A golden cross forms when a stock's 50-day moving average crosses above its 200-day average, signalling a potential shift to bullish momentum.
Key Highlights
- A golden cross occurs when the 50-day moving average rises above the 200-day moving average, indicating strengthening short-term momentum.
- JPMorgan Chase, GE Aerospace, and MP Materials are among US-listed companies that recently formed the pattern.
- Because moving averages are lagging indicators, a golden cross can appear after a significant portion of a rally has already occurred, and it may generate false signals in sideways markets.
What Is a Golden Cross?
A golden cross is a technical analysis signal that occurs when a short-term moving average crosses above a long-term moving average. The most widely watched version involves the 50-day moving average rising above the 200-day moving average on a price chart. Traders interpret the pattern as evidence that recent price momentum has strengthened enough to overtake the longer-term trend, which may indicate a shift from a weak or bearish market phase toward a more sustained period of gains.
Consider a straightforward example: if a stock's 50-day average rises to $102 while its 200-day average stands at $100, the crossover point constitutes a golden cross. The signal attracts attention partly because the 200-day moving average is widely used as a proxy for the long-term trend, making a break above it meaningful for many market participants.
How Traders Use the Signal
Market participants typically look for additional confirmation before acting on a golden cross in isolation. Supporting factors include a rising 200-day moving average (rather than one that is flat or declining), the share price remaining above both averages after the crossover, and an uptick in trading volume at the time of the signal. When these conditions align, the pattern is generally considered more reliable.
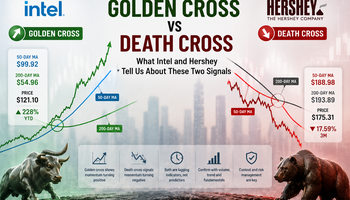
The opposite pattern, known as a death cross, occurs when the 50-day moving average falls below the 200-day moving average and is associated with a bearish outlook. Together, these two signals form a basic framework for trend-following strategies in equity and commodity markets.
Recent US Stocks That Formed a Golden Cross
Several US-listed companies formed or approached a golden cross in the week ended June 18, 2026.
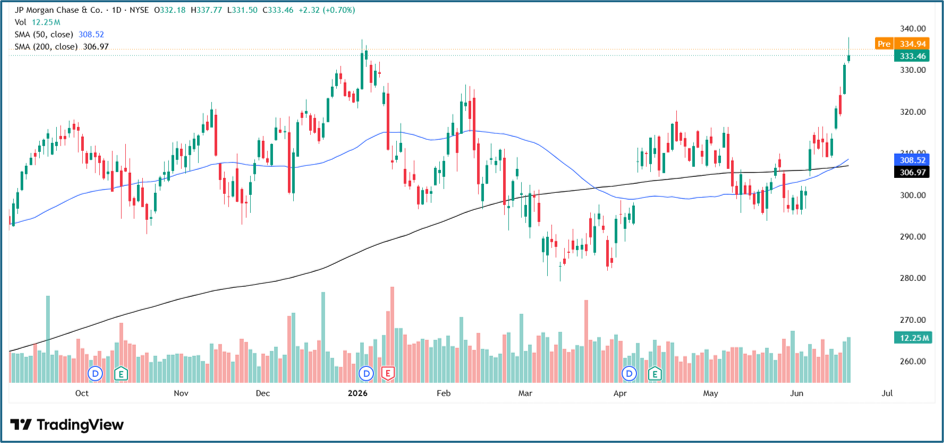
Among large-cap names, JPMorgan Chase (NYSE: JPM) drew attention after its 50-day moving average rose to approximately $307.84, just above its 200-day average of $306.72. The narrow spread suggests the crossover is relatively recent, which means both averages remain closely aligned and the signal could reverse quickly if the share price weakens.
GE Aerospace (NYSE: GE) showed a similarly tight configuration, with its 50-day average at around $308.36 against a 200-day average of $306.61. In the mid-cap space, MP Materials (NYSE: MP) presented a more pronounced spread, with the 50-day average near $62.34 compared to the 200-day average of $62.21, suggesting the crossover occurred somewhat earlier and has held with greater stability.
Other names that recently formed the pattern include First Solar (NASDAQ: FSLR), with a 50-day average of roughly $234.90 above its 200-day average of $233.51; Worthington Enterprises (NYSE: WOR), where the two averages stand near $55.61 and $54.43 respectively; Polaris (NYSE: PII), with averages of approximately $63.87 and $63.75; Korn Ferry (NYSE: KFY) at $67.41 versus $65.99; and Traeger (NYSE: COOK), which showed a wider gap with its 50-day average near $49.27 against a 200-day average of $45.90.
Limitations of the Signal
Despite its widespread use, the golden cross carries notable limitations. Because moving averages are constructed from historical price data, the signal is inherently lagging. By the time the crossover appears on a chart, a substantial portion of the price appreciation that prompted it may already have occurred. In volatile or range-bound markets, the pattern can also produce false positives, as averages cross repeatedly without establishing a durable trend.
The narrowness of the gap between the two averages at the time of crossover is one practical measure of signal quality. A very small spread, as seen in several of the recent examples above, indicates the crossover may be fragile, while a wider spread generally reflects a more established change in momentum.
Outlook
For stocks such as JPMorgan Chase and GE Aerospace, where the gap between the two averages remains thin, the durability of the golden cross will depend on whether the broader market continues to support elevated price levels. A pullback in either equity could push the 50-day average back below the 200-day average within weeks, negating the signal entirely. Stocks with wider spreads, such as MP Materials and Traeger, are less immediately vulnerable to a reversal of the crossover, though they remain subject to the same broader market risks.
Analysts caution that the golden cross is best used as one input among several rather than a standalone trading trigger. Fundamental analysis, volume trends, sector momentum, and macroeconomic context all remain relevant when evaluating whether the technical signal reflects a genuine change in the underlying trend.


 Please wait processing your request...