Intel's 50-day moving average sits $45 above its 200-day average, while Hershey's has crossed below. Here is what each signal means and why context is everything.
Key Highlights
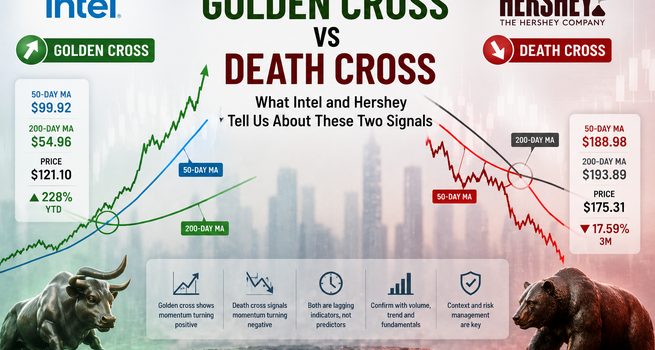
- Intel's 50-day moving average of $99.92 sits well above its 200-day average of $54.96, the result of a dramatic recovery that has sent the stock up 228% year-to-date to $121.10.
- Hershey's 50-day moving average of $188.98 has fallen below its 200-day average of $193.89, with the share price itself at $175.31 and down 17.59% over three months.
- Both signals are built from historical price data, which means they confirm what has already happened rather than predict what comes next.
How the Two Signals Work
Moving averages smooth out the noise of daily price swings to reveal the underlying direction of a trend. When the 50-day moving average and the 200-day moving average cross, the event can carry meaningful information about whether short-term momentum is outpacing or lagging the longer-term trend.
A golden cross forms when the 50-day average rises above the 200-day average, indicating that recent buying pressure has overtaken the longer-term trend. A death cross is the reverse, occurring when the 50-day average falls below the 200-day average, signalling that recent selling pressure is dragging momentum below the longer-term baseline. Both signals are most widely applied using daily closing prices, and both attract attention because the 200-day moving average is broadly used by institutional traders as a proxy for the primary trend.
Golden Cross: Intel
Intel (NASDAQ: INTC) carries one of the more striking golden crosses among large US-listed stocks at present. Its 50-day moving average stands at $99.92, against a 200-day moving average of $54.96, a spread of roughly $45. The share price itself trades at $121.10, sitting above both averages and up 228% year-to-date.
The spread reflects the violence of Intel's recovery. After the stock hit a 52-week low of $18.97, shares rebounded sharply as investor confidence in new chief executive Lip-Bu Tan's restructuring plan grew. The 50-day average, which reflects more recent prices, climbed rapidly. The 200-day average, still weighted toward the period of severe weakness, has been much slower to follow. The gap between the two is therefore not just a bullish signal; it is also a measure of how far the stock has come in a compressed time frame.
The wide spread is generally viewed as a sign that the golden cross is well-established and less vulnerable to near-term reversal than a narrow one. A crossover with only a few dollars of separation can be undone by a brief pullback. Intel's $45 gap offers considerably more buffer, though sustaining it requires the share price to remain elevated long enough for the 200-day average to continue rising.
Death Cross: Hershey
Hershey (NYSE: HSY) presents the opposite picture. Its 50-day moving average of $188.98 has fallen below its 200-day moving average of $193.89, with the share price at $175.31, trading beneath both averages. The stock is down 5.87% over one month, 17.59% over three months, and sits at just 19% of its 52-week range.
The configuration is notable because price, short-term average, and long-term average are all stacked in the same bearish order: the share price is below the 50-day, which is itself below the 200-day. This alignment across all three levels is generally considered a stronger confirmation of a downtrend than a crossover alone. The spread between the two averages is approximately $5, suggesting the death cross formed relatively recently.
For Hershey, the backdrop includes persistent cost pressures from elevated cocoa prices that have weighed on margins across the confectionery sector. The stock has lost nearly a quarter of its value from its 52-week high of $239.48, and neither moving average is yet showing signs of turning upward.
Why the Gap Between Averages Matters
A crossover where the two averages are only slightly apart is more fragile than one where the gap is wide. For Hershey, the $5 spread means a brief rally could push the 50-day back above the 200-day, negating the death cross signal. For Intel, the $45 gap means the golden cross has been in place long enough and with enough conviction to withstand a moderate pullback without reversing.
This is the practical reason traders look beyond the crossover event itself and monitor how the gap evolves. A widening spread after a golden cross adds confidence that the trend is holding. A widening spread after a death cross suggests the trend is deepening.
Outlook
Intel's golden cross is credible by the metrics most analysts apply: a wide spread, a share price above both averages, and consistent gains across multiple time horizons. The key risk is whether the recovery in its core semiconductor business can sustain share price levels high enough to keep pulling the 200-day average upward. Any meaningful deterioration in earnings momentum could cause the stock to retrace sharply, and the 50-day average would follow quickly.
For Hershey, the death cross reflects a genuine deterioration in price trend rather than a cosmetic signal. With the share price below both moving averages and gains negative across every measured time frame, a reversal of the death cross would require a sustained rally back above the $188 to $194 range, which would in turn require either a shift in the commodity cost environment or a stronger-than-expected recovery in consumer demand for its products.


 Please wait processing your request...