
Key Highlights
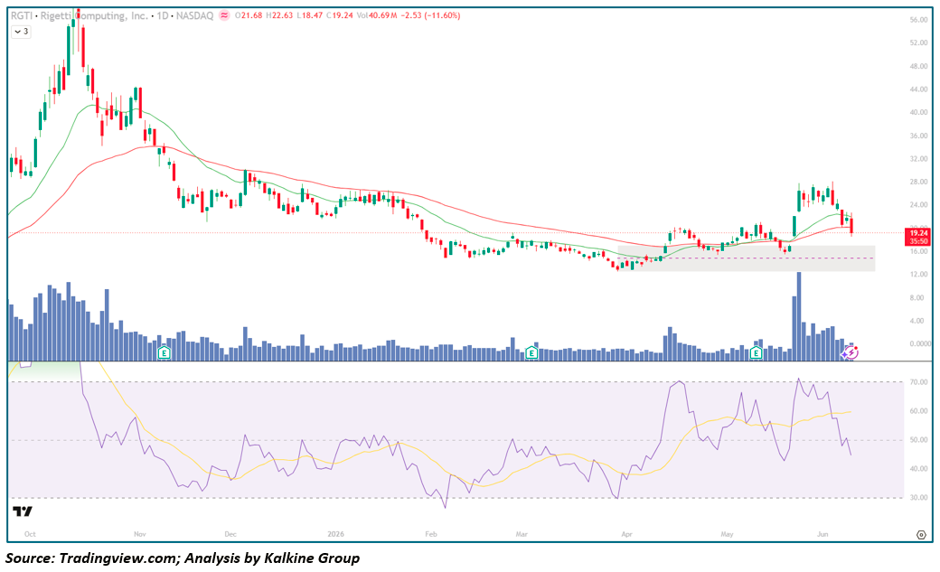
- RGTI closed at $19.24, plunging -$2.53 (-11.60%) on extraordinary Volume of 40.69M shares — the second largest volume session in the entire visible chart history, second only to the May breakout candle
- Price traded between $18.47 and $22.63 intraday, closing near session lows and reflecting relentless selling pressure throughout the day with zero meaningful intraday recovery
- Stock has broken decisively below both EMA-21 (~$21) and EMA-50 (~$20), erasing weeks of constructive Moving Average work in a single session
- RSI-14 has collapsed from a double peak near 70 in May back to approximately ~45 and falling rapidly, approaching the neutral-to-bearish threshold without yet triggering oversold conditions
- The gray shaded Demand zone of $15–$17 now comes back into direct focus as the primary structural support — the base from which the entire May–June rally launched
- RGTI has made a complete round-trip of its May breakout move, returning from the ~$29 highs back toward the pre-breakout consolidation range in under four weeks
- The stock remains one of the most volatile names in the Quantum Computing space, having declined from $55 highs in October 2025 to sub-$13 lows in February 2026 before staging its current recovery attempt
Trend Structure: Parabolic Peak, Multi-Month Collapse, and a Recovery Now Under Severe Threat
Phase 1 — Parabolic Blow-Off Top & Structural Collapse (Oct 2025 – Feb 2026)
RGTI entered the visible chart period in the final stages of an extraordinary speculative blow-off:
- The stock peaked near $55 in early October 2025 — a valuation that reflected peak quantum computing euphoria rather than fundamental Earnings power
- From that peak, the decline was swift, brutal, and unrelenting across the following four months, with price ultimately losing approximately 76% of its value by the February 2026 lows near $13
- EMA-21 crossed below EMA-50 in November and both moving averages maintained steep downward slopes throughout the entire decline, acting as dynamic resistance on every attempted bounce
- Volume remained elevated throughout the distribution phase, confirming institutional exit rather than passive selling
- RSI oscillated between the 30 and 55 zones without ever sustaining a recovery above the 60 level — a hallmark of a stock in genuine primary downtrend where every rally attempt fails to gain traction
- Multiple earnings markers appeared during the decline with each one either failing to spark a recovery or actively accelerating the selloff, reinforcing the narrative that the fundamental re-rating was as severe as the technical damage
Phase 2 — Capitulation Base & Quiet Accumulation (Feb – Apr 2026)
The February–March period marked a critical turning point as the selling momentum finally exhausted itself:
- Price found a durable floor in the $13–$17 range, establishing what the chart clearly identifies as the primary demand zone (gray shaded area) from which any recovery must be built
- RSI reached its most extreme oversold readings of the entire chart near the 30 level during this phase, signalling genuine selling exhaustion rather than merely temporary weakness
- Both EMA-21 and EMA-50 began flattening after months of downward slope — a necessary precondition for any trend Reversal
- Volume contracted materially during the base-building phase, consistent with the classic accumulation dynamic of Supply being absorbed quietly by patient buyers
- The horizontal dotted line visible near $20–$21 on the chart represents the prior resistance ceiling that capped multiple recovery attempts during this consolidation period — a key level that eventually became the launch point for the May breakout
Phase 3 — Explosive Breakout & Rapid Round-Trip (May – Jun 2026)
The May earnings catalyst produced one of the most explosive single-session moves in RGTI's recent history:
- The May earnings breakout candle — accompanied by by far the largest volume spike on the chart — launched price from the $17 base zone directly to the $28–$29 range within days
- EMA-21 and EMA-50 both turned sharply higher in unison, producing a bullish moving average alignment for the first time since the October 2025 peak
- RSI surged to near 70 — the most powerful momentum reading since the stock's speculative peak — reflecting genuine institutional re-engagement with the quantum computing narrative
- However, the $28–$29 zone proved to be formidable resistance, with sellers overwhelming buyers at the first meaningful test of the prior November–December 2025 consolidation area
- The reversal from the highs has been as rapid as the advance itself — today's -11.60% session on record-breaking volume represents a complete capitulation of the breakout and a return to the pre-catalyst price range
Moving Averages: Bullish Structure Dismantled in a Single Session
EMA-21 (~$21)
- Price has broken decisively below the EMA-21 on today's session, erasing the bullish moving average positioning that had been carefully built over the prior six weeks
- The EMA-21 had provided reliable dynamic support throughout the May–June advance and its loss on 40M+ share volume is a serious near-term bearish development
- A recovery back above $21 on expanding Buy-Side volume is the minimum requirement to suggest the correction is corrective rather than reversal in nature
EMA-50 (~$20)
- The EMA-50 sits near $20 and has been tested and potentially breached on today's session — a critical level given that it represents the medium-term trend anchor
- The fact that the EMA-50 is still rising from the February base provides a degree of structural support, but price trading at or below it removes the primary bullish argument
- The confluence of EMA-50 near $20 and the top of the gray demand zone creates an important support cluster in the $17–$20 range that bulls must defend
The $15–$17 Gray Demand Zone
- This shaded area on the chart represents the most important structural support on the entire chart — it is the base from which the May breakout launched and the region of maximum prior accumulation
- A retest of this zone would represent a complete round-trip of the entire May advance and would test the conviction of every buyer who participated in the breakout
- How price behaves on any approach to $15–$17 will be the defining technical event for RGTI over the coming weeks
Momentum Analysis: Double RSI Peak Warns of Distribution
RSI-14 at approximately 45 and falling tells a nuanced but cautionary story:
- The RSI formed a clear double peak near 70 across May and early June — a classic momentum divergence pattern where the second peak failed to exceed the first even as price made new highs, warning of underlying distribution
- This double-peak RSI structure is one of the most reliable bearish momentum signals in Technical Analysis and its resolution to the downside today confirms the warning it had been issuing for weeks
- The RSI signal line (yellow) has now crossed above the RSI line, providing an additional near-term bearish momentum confirmation
- The current RSI trajectory mirrors the November–December 2025 deterioration that preceded the most brutal leg of the prior primary downtrend — a historical parallel that demands serious attention
- A stabilisation and recovery of RSI back above 50 while price holds the $17–$20 support zone would be the most constructive outcome bulls can hope for; a deterioration below 40 would confirm a more serious structural breakdown
Volume Analysis: Record Selling Volume Cannot Be Dismissed
The volume profile today delivers an unambiguous bearish message:
- Today's 40.69M share session is the largest or near-largest volume day in the entire visible chart history, representing extraordinary institutional participation on the sell side
- The only comparable volume event was the May earnings breakout candle — the fact that an equivalent volume event has now occurred on the downside suggests the May buyers are exiting en masse
- Crucially, the highest volume day of the prior Bear Market (October–November 2025) coincided with the peak distribution phase before the most severe decline — today's volume print raises the uncomfortable parallel
- No signs of buying climax or demand absorption are yet visible in the current session's price-volume relationship; the close near session lows on maximum volume is a bearish continuation signal
Key Technical Levels
Resistance Levels
- $21–$22 — broken EMA-21 and recent consolidation zone now acting as immediate overhead resistance
- $24–$25 — prior June consolidation range
- $28–$29 — May breakout highs and primary recovery target for bulls
Support Levels
- $18.47 — today's intraday low and immediate downside reference
- $17–$20 — EMA-50 confluence with top of gray demand zone; critical near-term support cluster
- $15–$17 — primary gray shaded demand zone and base of the entire May breakout move
- $13 — February 2026 cycle low and ultimate structural backstop
Scenario Analysis
- Bullish Stabilisation (Base Case for Determined Bulls) If RGTI holds above the $17–$20 EMA-50 and demand zone confluence: → RSI stabilises near 40–45 and begins recovering back toward the 50 level on declining volume → Price reclaims EMA-21 ($21) on a subsequent session, confirming the correction has found its low → The quantum computing sector tailwind — including government mandates, cloud platform partnerships, and the IONQ re-rating lifting the entire sector — continues to attract institutional interest to the space → A recovery back above $24–$25 would restore the medium-term bull case and open a path back toward the $28–$29 breakout highs
- Deep Retest of the Base (Painful But Survivable) Price breaks below $17 and retests the core gray demand zone between $15–$17: → This would represent a complete erasure of the May breakout gains — painful for anyone who bought the momentum surge → However, the $15–$17 zone was a region of significant prior accumulation and would likely attract aggressive dip-buying if approached on declining volume → An RSI reading approaching 30 in this scenario would create the most oversold condition since the February capitulation — historically a high-conviction entry zone for patient long-term bulls → EMA-50 would likely converge with price in this zone, creating powerful support confluence
- Bearish Breakdown (Risk Case) A sustained close below $15 on heavy volume would represent a serious structural failure: → The entire May re-rating thesis would be called into question, suggesting the breakout was speculative rather than fundamental in nature → Downside risk could extend toward the February cycle low of $13 → RSI would approach extreme oversold readings, though in a confirmed downtrend oversold conditions can persist for extended periods → This scenario would suggest RGTI is reverting to its pre-2025 speculative quantum computing discount rather than participating in the sector's commercial maturation
Conclusion: RGTI Faces Its Most Significant Technical Test Since the February Capitulation Low
Rigetti Computing has delivered one of the most dramatic single-session reversals in the quantum computing space today, with the -11.60% plunge on record volume effectively dismantling the constructive technical structure that had been carefully built since the February lows. The RSI double-peak warning that was visible for weeks has now resolved decisively to the downside, and the breach of both key moving averages in a single session demands that bulls reassess their positioning and risk parameters immediately.
The $17–$20 support confluence — where the EMA-50, the top of the primary demand zone, and the pre-breakout consolidation area converge — is now the defining battleground. A hold here with volume contraction and RSI stabilisation would preserve the broader recovery narrative and offer a genuinely attractive risk-reward re-entry. A failure there would raise the very real prospect of a return to the February cycle lows near $13.
The framework going forward is clear:
- Above $21 (EMA-21) → correction complete, recovery resuming, target $24–$29
- Hold $17–$20 (EMA-50 + demand zone) → base rebuilding, defined-risk long opportunity emerging
- Below $15 (demand zone floor) → structural breakdown confirmed, February lows at $13 back in focus
- Below $13 (cycle low) → catastrophic bear scenario, complete round-trip of the recovery
For risk-tolerant quantum computing bulls, the $17–$20 zone represents the highest-conviction support cluster available on the chart — but today's extraordinary volume demands patience, confirmation of demand, and strict risk discipline before any re-engagement with the long side.


-Copy_06_09_2026_22_54_30_882342.jpg)
 Please wait processing your request...