
Key Highlights
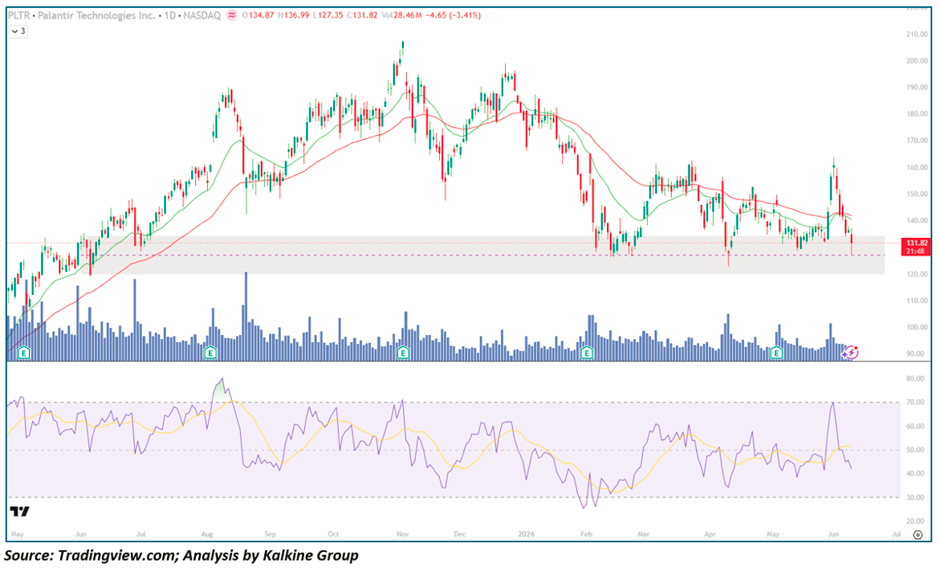
- PLTR closed at $131.82, falling -$4.65 (-3.41%) on Volume of 28.46M shares, with an intraday range of $127.35–$136.99 reflecting a close near session lows with no meaningful recovery attempt
- Price has broken decisively into the gray shaded Demand zone of $120–$135 — the most important structural support on the entire 14-month chart, a region that has absorbed selling on multiple prior occasions
- Both EMA-21 (~$143) and EMA-50 (~$145) are now well above current price and declining, having crossed into bearish alignment for only the second time in this visible chart — a structurally significant deterioration
- RSI-14 has declined from a peak near 70 in May back to approximately ~42 and falling, approaching the critical 35–40 oversold threshold that has historically marked PLTR's most powerful buying opportunities
- The stock has surrendered its entire May 2026 recovery rally — which briefly touched $165 — and is now trading at levels last seen during the February 2026 Capitulation phase, effectively wiping out four months of recovery work
- PLTR has traced an extraordinary double-top pattern across November 2025 (~$200) and January 2026 (~$185) peaks, with the subsequent decline now testing the very demand zone that provided the foundation for the initial AI-driven bull run
- Despite the near-term bearish picture, the gray demand zone between $120–$135 represents the most validated and consequential support structure on the chart — a zone where institutional accumulation has been most visible across the entire 14-month history
Trend Structure: AI Euphoria Peak, Prolonged Distribution, and Now the Structural Support Test
Phase 1 — Foundation Building & Initial AI Re-Rating (May – Jul 2025)
PLTR began the visible chart period in the early stages of what would become one of the most celebrated AI software re-ratings in recent market history:
- Price advanced steadily from the $80–$90 range in May 2025 toward $130–$140 by July, with both EMA-21 and EMA-50 in strong bullish alignment and rising at an accelerating slope
- RSI oscillated in the 55–70 zone throughout this phase — reflecting genuine institutional momentum without yet reaching the extreme overbought conditions that would define the later speculative phase
- Volume was consistently elevated on up-days, confirming professional Capital was actively building positions in anticipation of the AI government and commercial contract acceleration thesis
- The gray shaded demand zone of $120–$135 was first established during this phase as the critical support region — the level at which institutional buying was most aggressive and consistent during the initial breakout sequence
- This foundational phase established PLTR's character as a high-momentum, institutionally-driven AI name where the EMA-21 provided reliable dynamic support throughout the advance
Phase 2 — Parabolic Peak, Double-Top Formation & Distribution (Aug – Jan 2026)
The August–November 2025 period produced the most extraordinary price action in PLTR's visible chart history:
- Price surged from $140 to an all-time peak near $200 in November 2025 — an advance driven by peak AI government contract euphoria, extraordinary Earnings beats, and broad technology sector momentum
- RSI reached its single highest reading on the entire chart — near 80 — during the August acceleration phase, highlighted by the most prominent RSI peak visible in the panel
- The subsequent formation of a double top across the November $200 peak and the January 2026 $185 peak is the most significant bearish technical pattern on the entire chart — a classic distribution formation where institutional sellers systematically reduced exposure into retail buying strength across two separate price peaks
- EMA-21 crossed below EMA-50 during the December 2025 deterioration for the first time in the entire visible chart, confirming the transition from primary uptrend to distribution phase
- Volume expanded materially on the breakdown legs and contracted on the recovery attempts — the definitive accumulation-distribution signature of a stock undergoing major institutional repositioning
Phase 3 — Capitulation, Base & Recovery Attempt (Feb – May 2026)
The February 2026 selloff brought PLTR to the most critical test of its structural integrity:
- Price collapsed through the gray demand zone and briefly pierced its lower boundary near $120, reaching an intraday low near $115–$118 — the single most extreme oversold moment of the entire 14-month chart
- RSI plunged to approximately 28–30 — the most oversold reading on the chart and a level that has historically marked major capitulation lows in high-quality AI names
- The gray demand zone absorbed the selling with remarkable resilience — price closed back within the zone on the capitulation day and began recovering almost immediately, confirming the depth of institutional demand at this level
- The subsequent recovery from $120 to $165 in May 2026 appeared to validate the double-bottom thesis and generated real optimism that the post-peak distribution phase had fully resolved
- EMA-21 briefly crossed back above EMA-50 during the recovery phase — a tentative bullish crossover that ultimately failed to hold as the May peak gave way
Phase 4 — Failed Recovery, Renewed Distribution & Gray Zone Re-Entry (May – Jun 2026)
The May recovery's failure to sustain above $160 has now triggered the most consequential technical event of the current phase:
- Price has declined from the $165 May high back into the gray demand zone at $131.82 — a Reversal of approximately 20% in under four weeks
- The speed and volume of the decline confirm that the May recovery was a Bear Market rally rather than a genuine trend reversal — sellers were waiting at the prior resistance zone and have reasserted control decisively
- Both EMA-21 and EMA-50 have now rolled over from the recovery highs and are declining in bearish alignment above price — removing the Moving Average support that briefly appeared during the recovery phase
- RSI has declined from 70 to 42 in under three weeks — a velocity of deterioration that mirrors the pre-capitulation phases of both the December 2025 and February 2026 breakdown sequences
Moving Averages: Bearish Realignment Above Price Creates Significant Overhead Resistance
EMA-21 (~$143)
- Price is trading approximately $11 below EMA-21, which has rolled over sharply from the May recovery highs
- The EMA-21 served as reliable dynamic support throughout the entire initial 2025 bull run — its current position as overhead resistance rather than support represents the single clearest indicator of the trend shift
- A recovery above $143 on strong volume would be the minimum signal that the renewed selling phase has been arrested
EMA-50 (~$145)
- The EMA-50 has also turned lower and sits just above EMA-21, creating a tight dual moving average resistance cluster in the $143–$145 range
- Both declining moving averages converging above price is the most bearish moving average configuration available — every attempted recovery must overcome this resistance band before the medium-term trend can be considered constructive
- The $143–$145 zone must be decisively reclaimed on strong volume before any bull case can be responsibly advanced
The $120–$135 Gray Demand Zone
- This is the structural backbone of the entire PLTR bull thesis — the region that provided the launchpad for the AI re-rating advance and has absorbed aggressive selling on two prior occasions
- The zone is currently being tested for the third time, with today's intraday low of $127.35 penetrating well into its interior
- The lower boundary near $120 represents the absolute maximum downside tolerance for the medium-term bull case — a sustained close below $120 would represent a catastrophic structural breach
Momentum Analysis: Third RSI Deterioration Cycle — Pattern Recognition is Critical
RSI-14 at approximately 42 and falling must be interpreted in the context of PLTR's well-established RSI cycle pattern:
- The chart shows three distinct RSI deterioration cycles — August 2025 peak to September trough, November 2025 peak to February 2026 trough, and now the current May 2026 peak to present
- Each prior RSI trough reached the 28–35 oversold zone before a meaningful recovery began — the current reading of 42 suggests the RSI has not yet reached the exhaustion level that historically precedes PLTR's best buying opportunities
- The RSI signal line (yellow) has crossed above the RSI line for the third time in the visible chart — each prior crossing of this type preceded a significant price decline, reinforcing the near-term bearish momentum bias
- A decline of RSI to the 30–35 zone while price tests the $120–$125 lower boundary of the gray demand zone would create PLTR's most powerful oversold-at-support configuration — the closest parallel to the extraordinary February 2026 capitulation low that produced a 40%+ recovery
- Critically, if RSI fails to reach oversold levels before a potential bounce, the quality of any recovery would be suspect — genuine trend reversals in PLTR have consistently been preceded by RSI extremes
Volume Analysis: Sustained Selling Without Capitulation Spike
Volume provides important context for assessing where PLTR is in its current correction cycle:
- Today's 28.46M share session is elevated and meaningful but does not approach the extraordinary volumes seen during the November 2025 distribution peak or the February 2026 capitulation spike — the two defining volume events of this chart's history
- The absence of a true climactic volume spike during the current selloff suggests the correction may not have fully exhausted itself — the February capitulation was preceded by a dramatic volume surge that marked the exact session of maximum fear and the ultimate low
- The most recent major volume event was the May earnings-adjacent spike that coincided with the $165 recovery high — a pattern consistent with distribution into earnings strength, a recurring theme in PLTR's volume profile
- Any approach to the $120–$125 lower gray zone boundary on expanding volume followed by a sharp intraday reversal and recovery close would be the most reliable capitulation signal available in this name
Key Technical Levels
Resistance Levels
- $135 — upper boundary of gray demand zone; now acting as near-term resistance
- $143–$145 — EMA-21 and EMA-50 convergence zone; primary overhead resistance cluster
- $160–$165 — May 2026 recovery high and failed breakout ceiling
- $185–$200 — double-top distribution zone; long-term structural resistance
Support Levels
- $127.35 — today's intraday low and immediate downside reference
- $125 — mid-range of gray demand zone; near-term support
- $120 — lower boundary of gray demand zone and critical structural floor
- $115–$118 — February 2026 intraday capitulation low; ultimate bear scenario reference
Scenario Analysis
- Gray Zone Defence & Base Building (Primary Bull Case) If PLTR holds the $120–$135 gray demand zone — mirroring the February 2026 pattern — and RSI approaches oversold near 30–35: → The third test of this demand zone would create a powerful triple-bottom structure, the most bullish base formation available in Technical Analysis → RSI declining to 30–35 at gray zone support would replicate the February capitulation setup precisely — historically PLTR's highest-conviction buying opportunity → A recovery above EMA-21 ($143) and EMA-50 ($145) on strong volume would confirm the trend has re-established bullish structure → The AI government contract pipeline — including ongoing US defence and intelligence community deployments — provides a fundamental floor that distinguishes PLTR from purely speculative technology names
- Range-Bound Consolidation Within the Gray Zone Price stabilises within the $120–$135 range for an extended period: → RSI gradually resets toward the 40–50 zone without reaching extreme oversold readings → EMA-21 and EMA-50 descend toward the price range, compressing the moving average gap organically → A prolonged base within the gray zone would ultimately create the technical foundation for a more sustained recovery than the May 2026 bear market rally provided → This outcome preserves the long-term bull thesis while acknowledging that a further catalyst is required before the stock can mount a credible challenge of the $160+ resistance zone
- Gray Zone Failure (Bearish Breakdown) A sustained close below $120 on elevated volume would represent the most significant structural breach in PLTR's recent history: → The gray demand zone — validated by two prior recoveries — would be definitively violated → Downside risk extends toward the February intraday lows of $115–$118 and potentially to uncharted territory below $110 → RSI approaching extreme oversold conditions would eventually create a mechanical bounce, but a structural breakdown of the gray zone would require fundamental evidence of recovery before a durable long position could be justified → This scenario would imply the AI government contract growth narrative is facing headwinds severe enough to re-price even the most institutionally sponsored AI software Franchise
Conclusion: PLTR at the Grey Zone — The Most Important Technical Test Since the February 2026 Capitulation
Palantir stands at the most consequential technical juncture in its 14-month visible chart history — the gray demand zone that has defined the stock's structural floor across multiple correction cycles is being tested for the third time, with today's close at $131.82 sitting squarely within its boundaries. The historical precedent from this chart is as encouraging as it is demanding: each prior test of this zone resolved to the upside with extraordinary force, but each was also accompanied by RSI readings more extreme than the current ~42 level suggests. This creates the uncomfortable but important possibility that the gray zone test is not yet complete — that price may need to probe the $120–$125 lower boundary before the RSI exhaustion and volume capitulation signals that have historically marked PLTR's best buying opportunities are fully generated.
The framework going forward is unambiguous and clear:
- Hold $120–$135 gray zone + RSI approaching 30 → triple-bottom formation, highest-conviction long setup, recovery toward $145–$165 targeted
- Reclaim EMA-21/50 ($143–$145) → trend reversal confirmed, new recovery phase initiated
- Above $165 → May recovery high broken, fresh attempt at $180–$185 resistance zone
- Below $120 gray zone floor → structural breakdown, February intraday lows at $115–$118 back in focus, fundamental reassessment required
For institutional-grade AI software investors, the $120–$130 gray zone lower boundary represents the highest historical conviction entry point this chart has produced — but the RSI pattern demands patience until momentum exhaustion is confirmed, as premature entries ahead of the final washout have been consistently punished throughout PLTR's correction cycles.


-Copy_06_09_2026_22_54_30_882342.jpg)
 Please wait processing your request...