
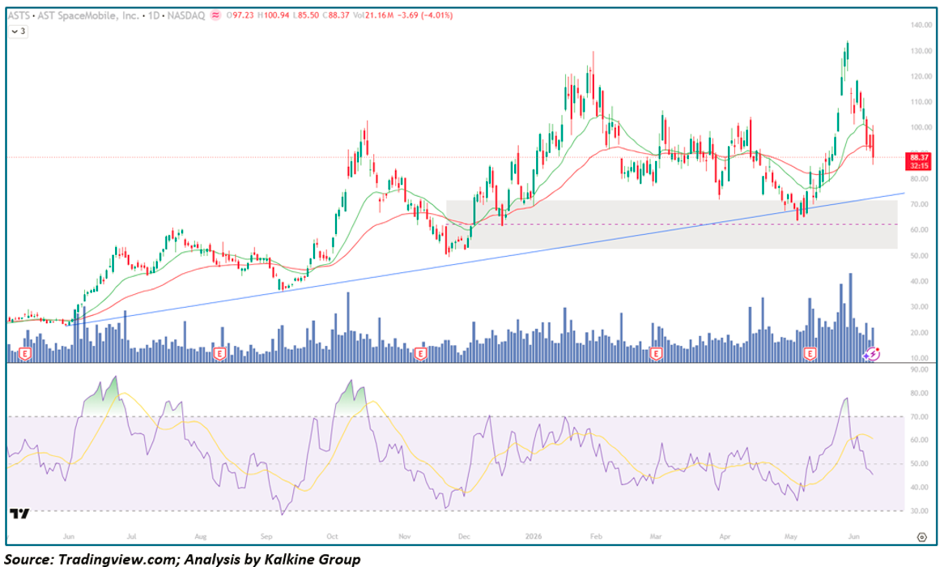
Key Highlights
- ASTS closed at $88.37, declining -$3.69 (-4.01%) on Volume of 21.16M shares, with an intraday range of $85.50–$100.94 reflecting a significant intraday rejection of the $100 psychological level
- Price is currently testing the rising blue long-term Trendline that has connected every major higher low since June 2025 — the single most important structural support on the entire chart
- Both EMA-21 (~$95) and EMA-50 (~$80) are visible, with price now breaking below the EMA-21 for the first time since the April recovery launch, while remaining above the still-rising EMA-50
- RSI-14 has rolled over sharply from the 80 zone in late May — its highest reading since the October 2025 peak — back to approximately ~45 and falling, a rapid decompression that mirrors prior correction cycles on this chart
- The gray shaded $60–$70 Demand zone represents the primary structural support floor, a region that has absorbed selling pressure on multiple occasions across the past 12 months
- ASTS has delivered one of the most powerful long-term advances in the space technology sector — rising from ~$27 lows in June 2025 to a $135 peak in May 2026, a gain of approximately 400% in under twelve months
- RSI has formed a clear pattern of overbought, green-shaded peaks followed by orderly corrections throughout the entire trend — today's pullback appears consistent with this recurring cycle rather than a structural breakdown
Trend Structure: Multi-Phase Institutional Accumulation Within a Dominant Long-Term Uptrend
Phase 1 — Base Launch & Initial Trend Establishment (Jun – Sep 2025)
ASTS began the visible chart period emerging from a low base near $27 and quickly established the foundational structure of what would become a dominant long-term uptrend:
- Price advanced steadily from $27 to the $45–$55 range over the June–September period, with the rising blue trendline beginning to connect the series of higher lows that defines the entire chart structure
- EMA-21 crossed above EMA-50 early in this phase, establishing the bullish Moving Average alignment that has remained largely intact throughout the entire advance
- RSI reached its first overbought peak near 80 in July 2025 — highlighted by the green shaded area on the RSI panel — before correcting back toward the 45–50 zone in a healthy digestion of initial gains
- Volume was moderate but consistently present on up-days, consistent with steady institutional accumulation rather than speculative retail-driven buying
- This initial phase established the critical pattern that would repeat across the entire chart: RSI overbought peak → orderly correction to trendline support → base rebuild → next leg higher
Phase 2 — First Major Breakout & Consolidation (Oct – Dec 2025)
The October Earnings catalyst ignited the most powerful single-leg advance to that point in the chart's history:
- Price surged from the $45 consolidation zone to a peak near $125 in October 2025 — a near 180% advance driven by what appeared to be a major fundamental re-rating of ASTS's satellite broadband commercial prospects
- RSI reached its second major overbought peak, highlighted by the second green shaded area on the RSI panel — again near the 80+ zone — before the inevitable correction began
- The subsequent pullback from $125 back toward the $60–$70 gray demand zone was sharp but orderly, with the blue rising trendline providing the ultimate support floor during the December lows
- EMA-21 and EMA-50 converged during this consolidation phase, with price oscillating between the two moving averages in a tight range that reflected genuine equilibrium between Supply and demand
- Volume expanded on the breakout and contracted during the correction — the classic accumulation-distribution signature of a healthy institutional uptrend
Phase 3 — Second Base, Recovery & New Highs (Jan – May 2026)
Following the December–January consolidation, ASTS rebuilt its base and launched an even more powerful advance:
- Price bottomed in the $60–$70 gray demand zone — precisely the level that had acted as resistance during the prior consolidation — confirming the classic resistance-turned-support dynamic
- The January–February base-building period saw EMA-21 and EMA-50 re-establish bullish alignment above the rising trendline, creating the technical foundation for the next major advance
- RSI recovered from the 40–45 correction zone back toward neutral and then overbought levels, reflecting the momentum restoration consistent with a trend continuation rather than a Reversal
- The May advance drove price to a new all-time high near $135 — a decisive breakout above the prior October peak that confirmed the long-term uptrend was accelerating rather than topping
- RSI reached its third overbought peak near 80 — again marked by the green shaded area — the most powerful momentum reading of the entire trend, reflecting extraordinary institutional conviction in the satellite broadband thesis
Phase 4 — Post-ATH Correction & Trendline Test (Late May – Jun 2026)
Following the $135 peak, ASTS has entered what appears to be its third major correction cycle within the dominant uptrend:
- Price has declined from $135 to the current $88.37 — a pullback of approximately 35% from the highs, comparable in magnitude to the prior October–December 2025 correction
- Today's intraday low of $85.50 tested the rising blue trendline from below, with the close at $88.37 suggesting the trendline is providing some initial support
- The pattern of RSI peaks followed by corrections to the 40–50 zone has now occurred three times across the visible chart, each time resolving to the upside — creating a compelling precedent for the current correction
- Critically, the long-term rising trendline has never been violated on a closing basis throughout the entire 12-month advance — making today's test the most significant trendline event in the stock's recent history
The Long-Term Rising Trendline — The Most Critical Technical Feature on the Chart
The blue diagonal trendline drawn from the June 2025 lows represents the structural backbone of ASTS's entire multi-quarter advance. It connects:
- The June 2025 base near $27 — the starting point of the entire bull run
- The September 2025 higher low near $38 — the first confirmation of the trendline as a structural support
- The December 2025 correction low near $60 — the second and most severe test of the trendline, which held perfectly
- The April 2026 recovery low near $65 — the third confirmation, with price bouncing aggressively from trendline contact
The trendline currently intersects in the $83–$87 range, aligning almost perfectly with today's intraday low of $85.50. This is not coincidence — it reflects the cumulative buying interest of the institutional participants who have consistently defended this structural level across the past twelve months. A daily close below the trendline on high volume would be the most significant bearish technical event in ASTS's recent history and would demand a fundamental reassessment of the entire bull case.
Moving Averages: EMA-21 Breached but EMA-50 Remains Bullishly Positioned
EMA-21 (~$95)
- Price has broken below the EMA-21 following today's session, the first meaningful violation since the April recovery launch
- Throughout the chart's history, EMA-21 breaches during correction phases have been temporary, with price recovering above it within days to weeks as each correction cycle completed
- A recovery back above $95 on expanding Buy-Side volume would signal the correction is ending and the uptrend is resuming
EMA-50 (~$80)
- The EMA-50 continues to trend higher and sits near $80 — still well below current price and rising rapidly
- Confluence between the EMA-50 near $80 and the rising blue trendline in the $83–$87 zone creates a powerful support cluster in the $80–$87 area
- A hold above the EMA-50 on any further weakness would preserve the structural integrity of the long-term uptrend — this level has not been tested since the April base-building phase
The $60–$70 Gray Demand Zone
- This shaded area represents the deepest support region on the chart — where the stock found buyers on two prior occasions during the December 2025 and January 2026 correction phases
- A retest of this zone would represent a deeper-than-average correction but would remain consistent with the broader uptrend structure if the rising trendline is subsequently reclaimed
- The gray zone aligns approximately with the 50% Retracement of the entire June 2025 to May 2026 advance — adding Fibonacci confluence to the horizontal support
Momentum Analysis: Third RSI Overbought Cycle Correcting — Historical Precedent Favours Bulls
RSI-14 at approximately 45 and declining is following the now well-established pattern of this chart precisely:
- The three prior RSI overbought peaks — July 2025, October 2025, and May 2026 — each highlighted by green shading on the RSI panel — all resolved through corrections that brought RSI back to the 40–50 zone before the next advance began
- The current RSI decompression from 80 to 45 is tracking the prior correction cycles almost identically in both speed and magnitude
- The RSI signal line (yellow) has crossed above the RSI line, providing a near-term bearish momentum confirmation consistent with the correction being in progress
- Crucially, RSI has never broken below 30 during any correction phase in this entire uptrend — suggesting that Bear Market oversold conditions have not been a feature of ASTS's correction cycles
- A stabilisation of RSI near 40–45 coinciding with price holding the trendline and EMA-50 confluence would be the most constructive possible signal that the third correction cycle is completing
Volume Analysis: Elevated Selling But No Capitulation Spike
Volume provides a nuanced but manageable picture for ASTS:
- Today's 21.16M share session is elevated relative to the recent average but does not represent the kind of catastrophic volume surge seen in RGTI or NOW — suggesting the selling is meaningful but not climactic
- The largest volume events on the chart have consistently been associated with earnings catalysts — visible at each "E" marker — and the most recent May earnings spike coincided with the $135 peak, a classic distribution-on-earnings pattern
- Pullback volume throughout each prior correction cycle has been notably lower than breakout volume — a constructive pattern that suggests supply is being distributed gradually rather than dumped aggressively
- Any further decline on decreasing volume toward the trendline and EMA-50 support zone would be the most encouraging possible volume signature for bulls
Key Technical Levels
Resistance Levels
- $95–$97 — broken EMA-21 and recent consolidation zone, now acting as immediate overhead resistance
- $100 — critical psychological round number; today's intraday high rejection at $100.94 confirms it as near-term resistance
- $115–$120 — prior June consolidation range and intermediate recovery target
- $135 — May 2026 all-time high and ultimate bull target for any full recovery
Support Levels
- $85–$87 — rising blue long-term trendline, currently being tested; most critical near-term support
- $80 — EMA-50 and secondary trendline confluence support
- $65–$70 — gray shaded primary demand zone; prior double-bottom support region
- $60 — lower boundary of gray demand zone and major structural floor
Scenario Analysis
- Bullish Trendline Defence (Primary Case — Consistent with Prior Cycles) If ASTS holds the rising blue trendline in the $83–$87 zone with today's wick suggesting initial demand: → RSI stabilises near 40–45, mirroring the prior two correction cycle lows exactly → Price recovers above EMA-21 ($95) and reclaims the $100 psychological level within days to weeks → The third correction cycle completes in a similar timeframe to the prior two — typically 4–6 weeks — before the next advance begins → A recovery back above $115–$120 would confirm the correction is complete and the path toward new all-time highs above $135 is open → The long-term satellite broadband commercialisation thesis — with major telecom partnerships and global coverage milestones — continues to attract institutional Capital at each correction
- Deeper Correction to Gray Demand Zone (Painful But Structurally Intact) Price breaks below the trendline and tests the $65–$70 gray demand zone: → This would represent a deeper correction than the two prior cycles but would remain within the bounds of the long-term uptrend if price recovers above the trendline subsequently → EMA-50 would converge with price in the $70–$75 range, creating powerful moving average support → RSI approaching the 35–40 zone in this scenario would represent the most oversold reading since the June 2025 base — historically a high-conviction accumulation signal in this name → A successful hold and reversal from the gray zone would create the most powerful base since the stock's original launch, setting up a potentially explosive recovery
- Bearish Trendline Breakdown (Risk Case) A sustained daily close below the rising trendline (~$83–$85) on heavy volume would represent a structural shift: → The 12-month uptrend that has defined every aspect of ASTS's technical character would be violated for the first time → Downside risk could extend toward the $60 lower boundary of the gray demand zone → RSI would likely break below 40 and approach oversold territory, though trend deterioration can persist through oversold conditions → This scenario would suggest the satellite broadband commercial timeline is facing headwinds serious enough to disrupt the institutional accumulation thesis that has driven the stock's extraordinary advance
Conclusion: ASTS at the Most Pivotal Technical Moment of Its Entire 12-Month Bull Run
AST SpaceMobile stands at the most significant technical crossroads in its entire documented uptrend — the rising long-term trendline that has defined every major correction and recovery for twelve months is being tested right now, with today's intraday wick at $85.50 representing the closest the stock has come to violating this structural cornerstone since the trend began. The encouraging news for bulls is that the historical pattern of this chart is unambiguous and consistent: three prior RSI overbought peaks, three corrections to the 40–50 RSI zone, three trendline touches, and three powerful subsequent advances. The current setup is tracking this pattern with remarkable precision.
The framework going forward is definitive:
- Hold trendline ($83–$87) + EMA-21 reclaim ($95) → third correction complete, new all-time high attempt toward $135+ begins
- Above $100 → psychological confirmation of recovery, momentum rebuilding toward $115–$120
- Break trendline + hold $65–$70 gray zone → deeper correction but uptrend structurally intact, highest-conviction long-term entry since June 2025
- Below $60 (gray zone floor) → structural breakdown, long-term bull thesis requires fundamental reassessment
For long-term investors in the satellite broadband revolution, the $83–$90 trendline and EMA-21 zone represents the most historically validated entry point this chart has produced — a level where patient institutional capital has shown up consistently and decisively across four separate occasions over the past twelve months.


-Copy_06_09_2026_22_54_30_882342.jpg)
 Please wait processing your request...