-Copy_06_09_2026_22_54_30_882342.jpg)
Key Highlights
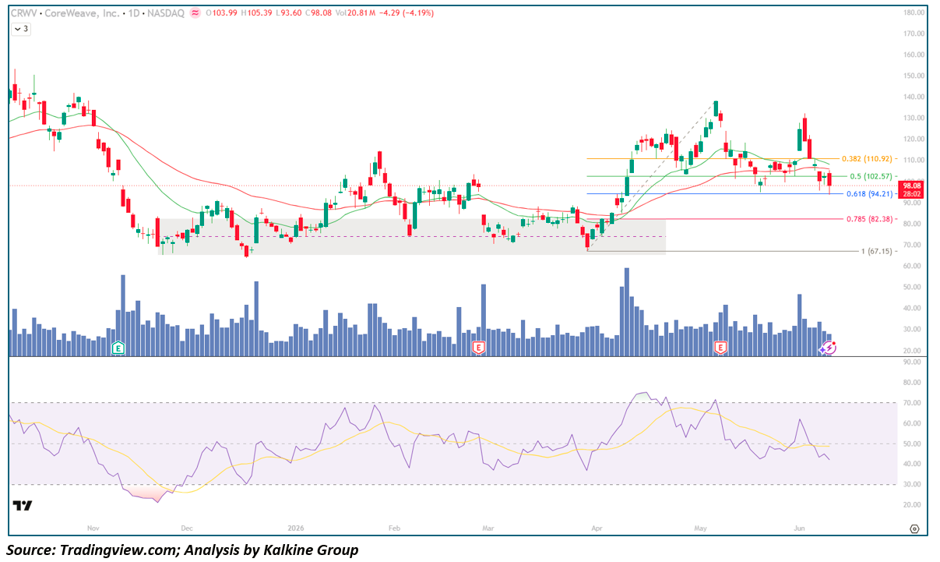
- CRWV closed at $98.08, declining -$4.29 (-4.19%) on Volume of 20.81M shares, with an intraday range of $93.60–$105.39 reflecting a significant intraday recovery from session lows but an ultimately bearish close
- Price is currently testing the 0.5 Fibonacci Retracement level at $102.57 and has briefly pierced the 0.618 golden ratio at $94.21 on an intraday basis — placing the stock at the most critical technical juncture since its post-IPO base
- Both EMA-21 (~$108) and EMA-50 (~$100) have been broken, with price now trading below both moving averages for the first time since the March breakout launch
- RSI-14 has declined from its peak near 75 in April back to approximately ~45 and falling, approaching the neutral-to-bearish threshold in a trajectory that mirrors the November–December 2025 deterioration
- The gray shaded $67–$80 Demand zone — the base from which the entire March–May rally was launched — represents the ultimate structural floor for the post-IPO bull case
- CRWV has delivered an extraordinary post-IPO performance, advancing from the $67 base to a $143 peak — a gain of approximately 113% from its foundational lows — before the current correction began
- The Fibonacci retracement tool reveals a stock sitting precisely at the most contested battleground of its short public market history, with the 0.5 and 0.618 levels converging with key moving averages to create the most powerful support cluster on the entire chart
Understanding the Fibonacci Retracement Plotted on the Chart
The Fibonacci retracement has been drawn from the cycle low of $67.15 (the "1.0" level at the bottom of the scale, representing the post-IPO base low in the gray demand zone) up to the cycle high of approximately $143 (the 0 level at the top, representing the April–May peak). This measures the key retracement zones of the entire post-base recovery rally. Here is what each level means in the context of this chart:
0.382 Retracement — $110.92 (Yellow Line) This represents a 38.2% pullback from the $143 peak toward the $67 base. This level has already been decisively breached following the May distribution phase, confirming the correction has more depth than a shallow pullback. In a strong institutional uptrend, the 38.2% level is typically the first and mildest retracement that confident bulls defend — its loss signals that Supply is meaningfully overcoming demand and deeper support levels must absorb the selling. The $110.92 level now acts as the first overhead resistance that any recovery rally must reclaim.
0.5 Retracement — $102.57 (Green Line) The 50% retracement at $102.57 represents the exact midpoint of the entire post-base rally — the equilibrium point where the advance has been precisely half-retraced. This is the level currently being tested, with today's close at $98.08 representing a breach of this level on a closing basis for the first time. The 50% retracement is universally respected as a critical support level because it represents a fair valuation test — the market is literally splitting the difference between the base and the peak. A sustained hold above $102.57 with recovering volume would signal institutional defence of the uptrend; a confirmed close below it shifts the probability weight toward the 0.618 level becoming the next primary target.
0.618 Retracement — $94.21 (Blue Line) The 61.8% retracement at $94.21 is the "golden ratio" — the most mathematically significant and widely watched Fibonacci level in Technical Analysis. Today's intraday low of $93.60 pierced this level by a fraction before recovering, creating a potentially significant "wick rejection" that suggests demand exists at this zone. The $94.21 level carries extraordinary technical weight for CRWV because it also coincides with the top of the gray shaded demand zone (~$80–$95) and the approximate level of the EMA-50 — creating a three-way confluence of Fibonacci, horizontal, and Moving Average support within a tight price range. A daily close below $94.21 on heavy volume would be a materially bearish development, implying the correction is entering its most dangerous phase.
0.785 Retracement — $82.38 (Pink/Red Line) The 78.5% retracement at $82.38 sits within the gray demand zone and represents the last meaningful Fibonacci defence before a complete round-trip of the rally. A decline to this level would represent a ~42% correction from the $143 highs — deeply painful for momentum buyers but still technically survivable for the long-term bull thesis if the gray demand zone absorbs the selling. This level aligns with the mid-range of the prior base consolidation, adding powerful horizontal confluence to the Fibonacci support.
1.0 Level — $67.15 (Dark Line) This marks the origin of the Fibonacci measurement — the post-IPO cycle low that defined the bottom of the gray demand zone. A return to this level would represent a complete 100% retracement of the entire post-base rally, effectively returning CRWV to its IPO-period lows. This is the catastrophic bear scenario and would imply a fundamental re-assessment of the entire AI infrastructure Investment thesis driving the stock.
Trend Structure: Post-IPO Base, Explosive Breakout, and Now the Fibonacci Reckoning
Phase 1 — Post-IPO Distribution & Base Formation (Oct – Feb 2026)
CRWV entered the visible chart period in a post-IPO distribution phase — a common pattern for newly listed high-profile technology companies as early investors reduce exposure and the market establishes Fair Value:
- Price declined from the initial $140+ range in October 2025 all the way to the $67–$80 gray demand zone by December 2025, establishing the foundational base that the entire subsequent bull case rests upon
- The December low near $67 — the RSI's most oversold reading visible on the chart, highlighted by the green shaded area near the 28–30 zone — marked the definitive Capitulation point and the origin of the Fibonacci measurement
- EMA-21 and EMA-50 both declined steeply during this phase and remained in bearish alignment above price, acting as overhead resistance that suppressed every attempted recovery through January and February 2026
- Volume remained elevated during the distribution phase and contracted during the base consolidation — the classic signature of supply being exhausted and demand quietly absorbing the float
- The gray shaded demand zone of $67–$80 is the most important price region on the entire chart — it has been tested multiple times and represents the maximum level of prior institutional accumulation
Phase 2 — Breakout Launch & Parabolic Advance (Mar – May 2026)
The March catalyst — visible as the explosive breakout candle accompanied by the chart's highest volume spike — launched CRWV from its base into a near-parabolic advance:
- Price surged from the $80–$90 base area to a peak near $143 in under eight weeks — an advance of approximately 75% from the breakout launch point
- Both EMA-21 and EMA-50 turned sharply higher in unison, producing a powerfully bullish moving average configuration for the first time since the stock's IPO period
- RSI advanced from the neutral 50 zone to a peak near 75 — reflecting genuine institutional momentum rather than speculative excess, though clearly entering territory that warranted attention
- The dashed diagonal Trendline visible on the chart traces the slope of this parabolic advance, connecting the series of higher lows during the surge phase — a line that was eventually broken when the $143 distribution phase began
- Volume expanded consistently throughout the advance and then spiked dramatically at the April Earnings event, which appears to have acted as a distribution catalyst at the peak
Phase 3 — Distribution, Fibonacci Correction & Current Test (May – Jun 2026)
The Reversal from the $143 peak has been persistent and has now reached the most technically critical point of the entire correction:
- Price has declined from $143 to the current $98.08 — a correction of approximately 31% from the highs — with the speed and sustained nature of the selling confirming institutional distribution rather than retail profit-taking
- The 0.382 Fibonacci level at $110.92 was lost relatively quickly, accelerating the move toward the deeper 0.5 and 0.618 levels now being tested
- Today's intraday breach of the 0.618 Fibonacci at $94.21 before recovering to $98.08 creates an interesting technical picture — a wick through the golden ratio that suggests demand exists but has not yet overpowered the selling pressure decisively
- RSI at ~45 and declining has not yet reached the oversold zone that historically marks high-conviction buying opportunities in this name — suggesting patience remains warranted before declaring the correction complete
Moving Averages: Both Key Averages Breached — EMA-50 Now the Critical Defence
EMA-21 (~$108)
- Price has broken decisively below EMA-21, which has now flattened and begun rolling over — a near-term bearish signal
- The EMA-21 at $108 represents immediate overhead resistance; any recovery above this level would be the first constructive signal that the selling pressure is abating
- Given the velocity of the current decline, a recovery above EMA-21 would require a meaningful fundamental catalyst or a sharp short-covering rally to be sustained
EMA-50 (~$100)
- The EMA-50 near $100 is the most important moving average for CRWV's medium-term trend assessment — it is still rising from the March base and converges near the 0.5 Fibonacci at $102.57
- Price trading below the EMA-50 on a closing basis for the first time since the March breakout is a meaningful deterioration, but the confluence with the 0.5 Fibonacci creates a powerful combined support cluster in the $100–$103 zone
- A recovery back above $100–$103 on strong volume would restore the medium-term bullish case; a sustained hold below $100 would raise the probability of testing the 0.618 Fibonacci at $94.21 and the gray demand zone below
The $67–$80 Gray Demand Zone
- The foundational support region of the entire CRWV bull thesis — where maximum institutional accumulation occurred during the post-IPO base
- Any approach to this zone would represent a near-complete round-trip of the breakout rally and would likely attract significant long-term value buying given the extraordinary AI infrastructure tailwinds
- The lower Fibonacci levels (0.785 at $82.38 and 1.0 at $67.15) both fall within or immediately adjacent to this zone, adding overwhelming Fibonacci confluence to what is already the strongest horizontal support on the chart
Momentum Analysis: RSI Approaching but Not Yet at Corrective Lows
RSI-14 at approximately 45 and declining delivers a mixed but cautionary message:
- The RSI has not yet reached the oversold territory (30–35) that marked the December 2025 capitulation low — suggesting the correction may not be exhausted despite the already significant price decline
- The RSI signal line (yellow) has now crossed above the RSI line, confirming near-term bearish momentum persistence
- A decline of RSI to the 35–40 zone while price tests the $94–$100 Fibonacci and EMA confluence would create the most historically reliable buy signal in the stock's visible chart history
- Conversely, a stabilisation of RSI above 45 while price holds above $100 would suggest the selling is losing velocity and a base is forming at the current level
Volume Analysis: Consistent Selling Without Climactic Exhaustion
Volume tells an important story for understanding where CRWV is in its correction cycle:
- Today's 20.81M share session is elevated but not extreme — notably below the April earnings spike which represented the chart's single largest volume event and the probable distribution peak
- The correction has been characterised by consistently elevated but not climactic selling — suggesting a methodical institutional exit rather than a panic-driven washout
- Climactic volume accompanied by a sharp intraday reversal (similar to today's wick from $93.60 back to $98.08) is often the precursor to a correction low — but confirmation across multiple sessions is required before drawing that conclusion
- A decline on materially reduced volume toward the 0.618 Fibonacci and gray demand zone would be the most constructive possible volume signature for bulls
Key Technical Levels
Resistance Levels
- $102.57 — 0.5 Fibonacci retracement, now broken on a closing basis; must be reclaimed for near-term recovery
- $108–$110 — EMA-21 and 0.382 Fibonacci convergence zone; primary resistance ceiling
- $120–$125 — prior May consolidation and intermediate recovery target
- $143 — cycle high and ultimate bull target for any full recovery advance
Support Levels
- $94.21 — 0.618 golden ratio Fibonacci; today's wick low at $93.60 tested this level
- $90–$95 — EMA-50 confluence with top of gray demand zone; critical support cluster
- $82.38 — 0.785 Fibonacci retracement within gray demand zone
- $67–$80 — primary gray shaded demand zone; post-IPO base and foundational support
- $67.15 — 1.0 Fibonacci level and post-IPO cycle low; catastrophic bear scenario
Scenario Analysis
- Bullish Golden Ratio Defence (Primary Case) If CRWV holds above the 0.618 Fibonacci at $94.21 — as today's intraday wick recovery suggests is possible: → RSI stabilises near 40–45 and begins recovering toward the 50 level on declining correction volume → Price reclaims the 0.5 Fibonacci ($102.57) and EMA-50 ($100) on a subsequent session with strong volume → The AI infrastructure demand thesis — underpinned by hyperscaler GPU cloud contracts, Microsoft and other enterprise partnerships — attracts institutional dip-buying at the golden ratio → Recovery above the 0.382 Fibonacci ($110.92) and EMA-21 ($108) would confirm the correction is complete and set up a retest of the $130–$143 range
- Gray Demand Zone Retest (Painful But Fundamentally Supported) Price breaks below $94 and retests the gray demand zone between $80–$90: → This would represent a ~40% total correction from the $143 highs — severe but consistent with the magnitude of CRWV's prior post-IPO decline → The 0.785 Fibonacci at $82.38 and the gray zone horizontal support create an extraordinarily powerful support cluster → An RSI reading approaching 30–35 in this scenario would create the most oversold condition since the December 2025 capitulation — historically the highest-conviction entry opportunity in this name → AI infrastructure demand fundamentals — including massive hyperscaler capex commitments and cloud GPU shortages — provide a valuation floor that should attract long-term buyers well above the cycle lows
- Bearish Breakdown (Risk Case) A sustained close below $80 (gray demand zone floor) on heavy volume would represent a structural failure: → The 0.785 Fibonacci and gray zone support would both be violated, implying the post-IPO re-rating is reversing → Downside risk extends toward the 1.0 Fibonacci at $67.15 — a complete erasure of the post-base rally → RSI would approach extreme oversold readings, though confirmed downtrends can sustain oversold conditions for extended periods → This scenario would suggest the AI infrastructure investment cycle is facing headwinds severe enough to undermine even the most fundamentally compelling names in the sector
Conclusion: CRWV at the Golden Ratio — The Definitive Technical Test of the Post-IPO Bull Thesis
CoreWeave finds itself at the most consequential technical juncture of its public market existence. The intraday pierce of the 0.618 golden ratio Fibonacci at $94.21 — followed by a partial recovery to $98.08 — suggests that demand exists at this critical level, but today's close below the 0.5 Fibonacci ($102.57) means the selling has not yet been definitively rejected. The convergence of the 0.618 Fibonacci, the rising EMA-50, and the top of the gray demand zone in the $94–$100 range creates the most powerful support cluster on the entire chart — a zone that is simultaneously the most important technical level and the most attractive risk-reward entry point since the March breakout launch.
The framework going forward is unambiguous:
- Reclaim $102.57 (0.5 Fib) + $108 (EMA-21) → correction complete, recovery toward $120–$143 begins
- Hold $94.21 (0.618 Fib) + EMA-50 ($100) → golden ratio defence, highest-conviction long entry with defined risk
- Break $94 toward $82.38 (0.785 Fib) → deeper correction confirmed, gray demand zone becomes the battleground
- Below $67.15 (1.0 Fib) → structural breakdown, post-IPO bull thesis requires complete reassessment
For AI infrastructure bulls, the $94–$100 golden ratio and EMA-50 confluence zone represents the single highest-conviction technical entry point available on this chart — but given today's close below the 0.5 Fibonacci, one additional session of confirmation that demand is absorbing supply at this level is strongly advisable before committing Capital.


 Please wait processing your request...