
 CA
 NZ
 UK
 AU
 IND

 US

 Share
 X (Formerly Twitter)
 Whatsapp
 Facebook
 LinkedIn
 Telegram
 Email This Article
 Copy Link
 Summarize with AI
 Chat GPT
 Perplexity

Key Momentum Shifts
- Eight sectors occupy Leading: Industrials (XLI), Real Estate (XLRE), Financials (XLF), Consumer Discretionary (XLY), Health Care (XLV), Materials (XLB), Utilities (XLU) and Consumer Staples (XLP).
- Real Estate, Financials and Health Care show elevated positioning: These sectors are among the more strongly positioned leaders, with latest points well above and to the right of the central axes.
- Industrials remains in Leading: XLI is relatively close to the vertical midpoint but remains above the horizontal axis, confirming positive relative strength and momentum.
- Energy is the only sector in Weakening: XLE remains to the right of the vertical midpoint but substantially below the horizontal axis, indicating positive relative strength alongside deteriorating momentum.
- Technology and Communication Services remain in Lagging: XLK and XLC are positioned in the lower-left quadrant, with Technology displaying the more pronounced negative relative positioning.
The Relative Performance Visualization for 6 November 2026 shows eight US sectors in Leading, one in Weakening and two in Lagging. Industrials, Real Estate, Financials, Consumer Discretionary, Health Care, Materials, Utilities and Consumer Staples occupy the upper-right quadrant. Energy remains right of the vertical axis but well below the horizontal midpoint. Communication Services and Technology remain in the lower-left quadrant, with Technology displaying the most pronounced negative positioning.
Relative Leadership remains broad, but the plotted tails show differences in momentum strength and direction. Real Estate, Financials and Health Care occupy elevated positions, while Industrials is closer to the centre of Leading. Energy’s Weakening position indicates negative momentum despite positive relative strength. Technology and Communication Services remain weak, and no sector has rotated into Improving.
US Sector Momentum Quadrants
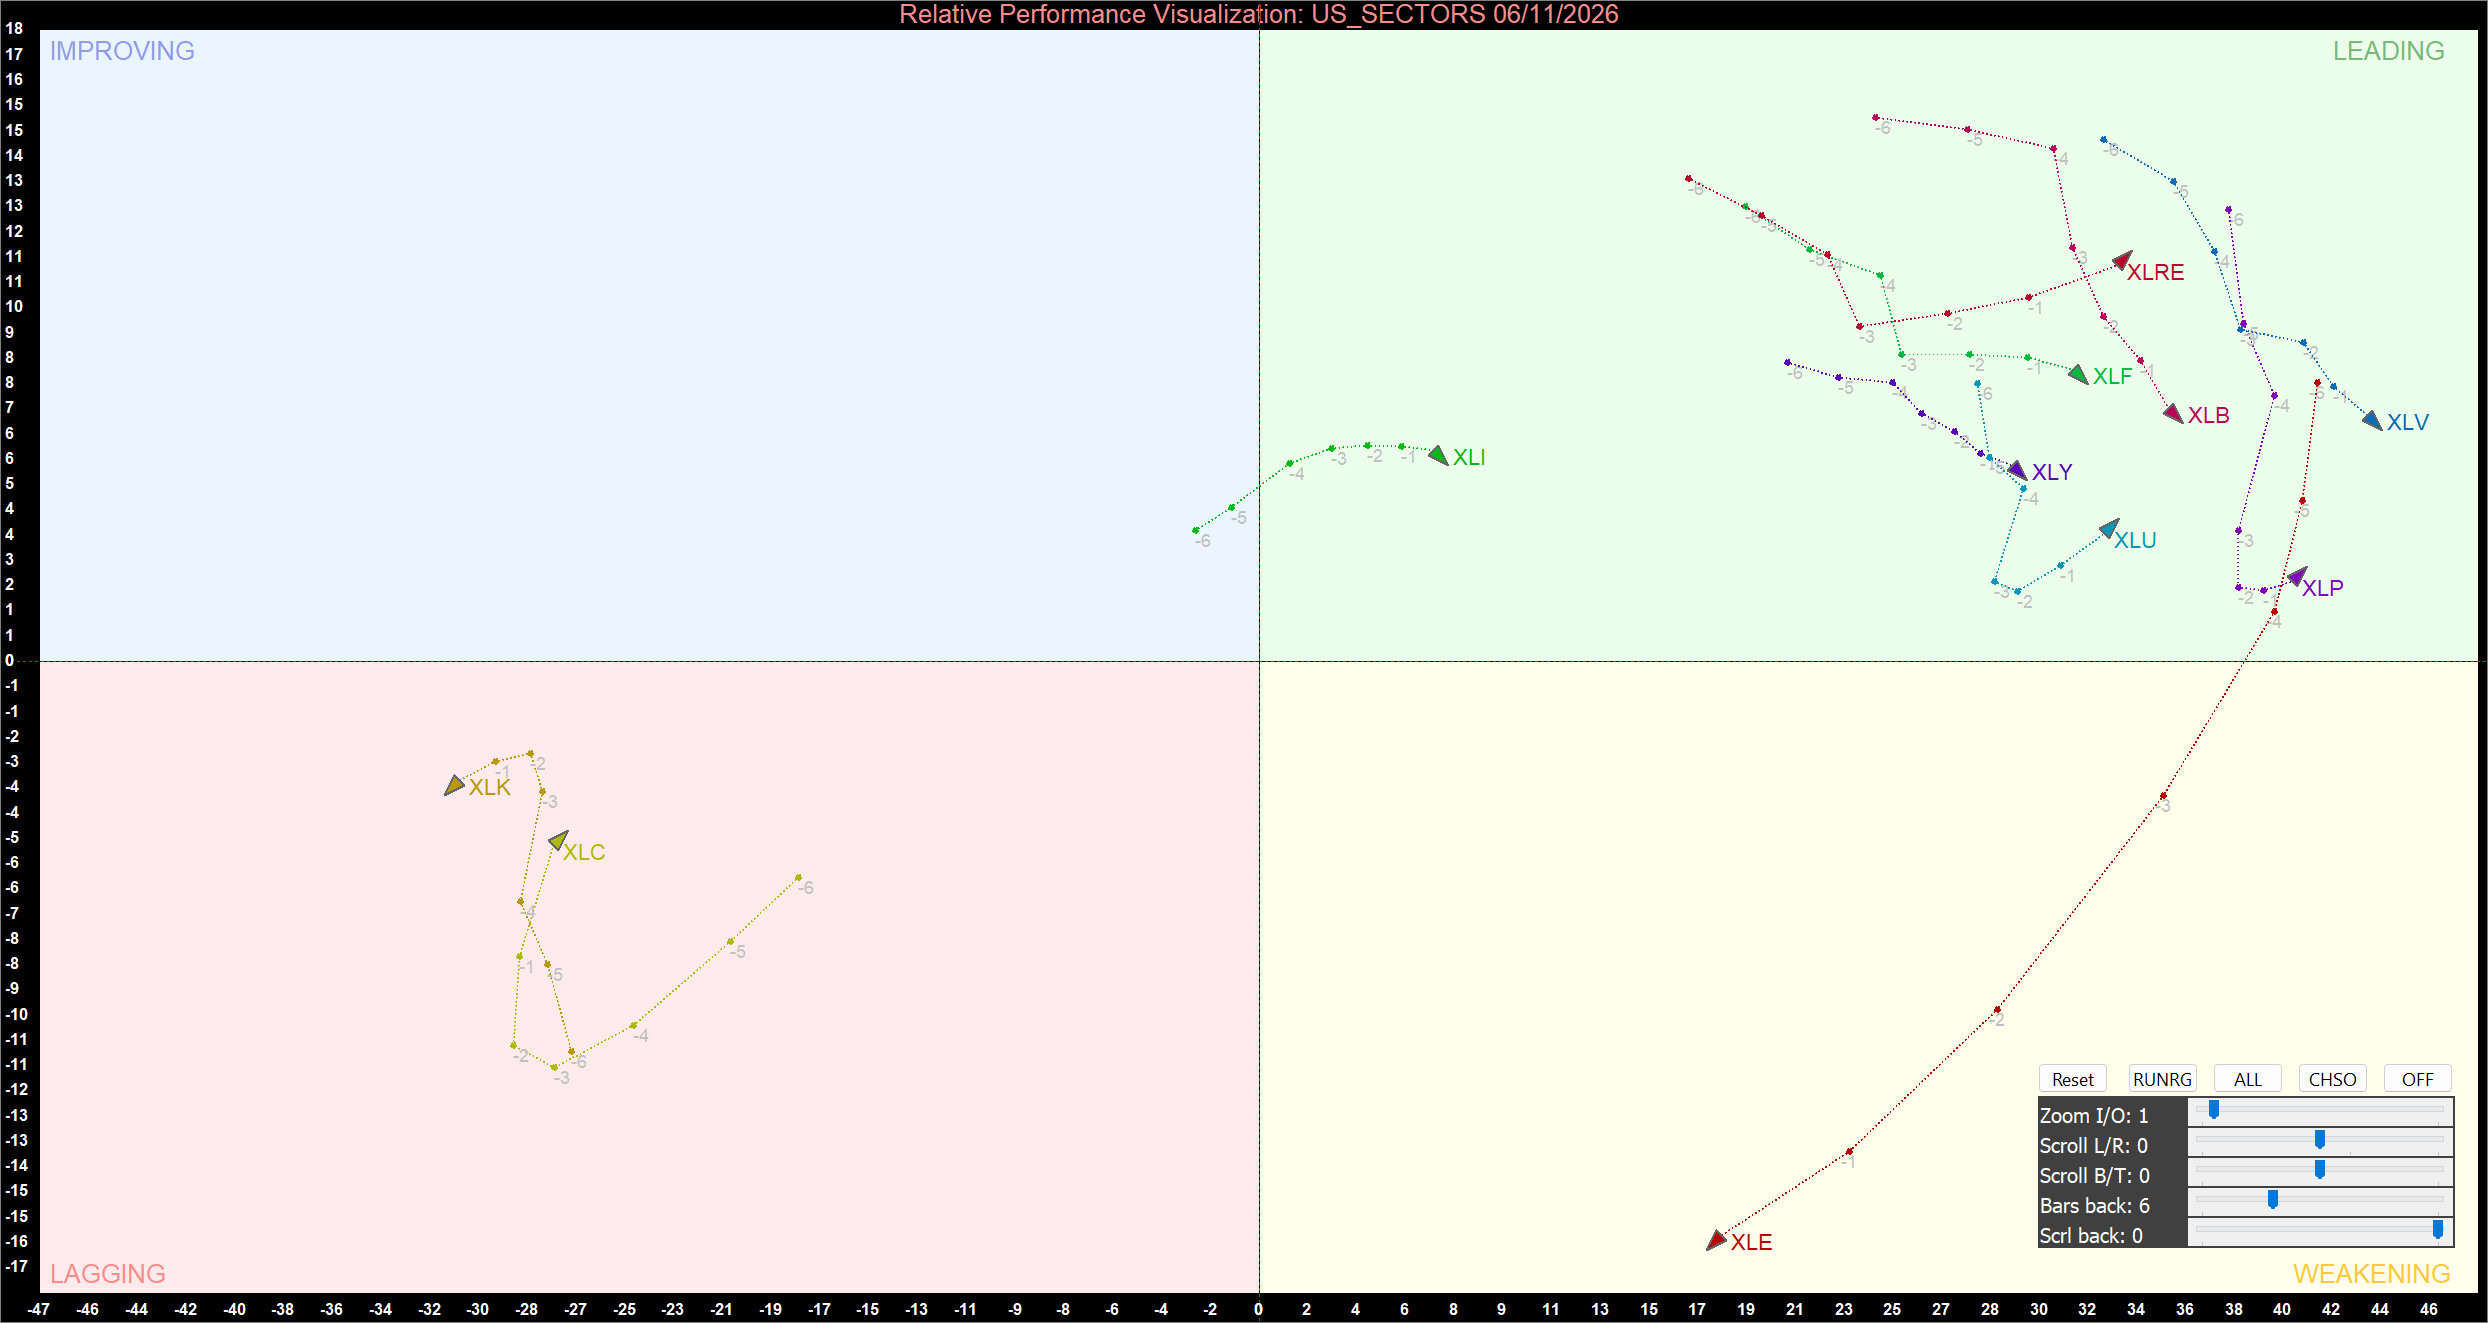
US Sector Relative Momentum Chart at the closing price of 06/11/2026. Powered by: amibroker.com.
Leading Quadrant
Industrials (XLI), Real Estate (XLRE), Financials (XLF), Consumer Discretionary (XLY), Health Care (XLV), Materials (XLB), Utilities (XLU) and Consumer Staples (XLP) occupy Leading. Their positions above and to the right of the central axes indicate positive relative strength and momentum. This is the broadest group on the chart, although momentum strength differs between sectors.
Industrials is positioned relatively close to the vertical midpoint but remains above the horizontal axis. This confirms positive relative strength and momentum, although its proximity to the centre makes its leadership less pronounced than that of sectors further to the right. A sustained upward or rightward trajectory would strengthen confirmation of its Leading position.
The other Leading sectors are spread across the upper-right quadrant. Real Estate and Financials are positioned in the upper region, while Health Care is also elevated and further to the right. Materials and Consumer Discretionary occupy positive territory at intermediate positions. Utilities and Consumer Staples remain above the horizontal axis, although closer to its boundary. Their different tails indicate that Leading membership does not mean identical momentum strength or direction.
Position and trajectory should be considered together. A sector can remain in Leading while its tail turns lower or moves toward the centre, signalling a narrowing relative advantage. Sustained upward or rightward movement would instead indicate strengthening momentum. Subsequent plotted points will help determine whether current leaders can maintain their advantage.
Weakening Quadrant
Energy (XLE) is the only sector in Weakening. Its latest point remains right of the vertical midpoint, indicating positive relative strength, but is substantially below the horizontal axis, signalling negative momentum. Energy therefore retains a relative-strength advantage even as its momentum deteriorates.
Energy is positioned materially to the right of the central axis and has not yet lost its relative-strength standing. However, its position deep below the horizontal axis highlights the extent of the negative momentum reading. Continued downward movement could narrow its relative advantage and increase the risk of a move into Lagging. A sustained upward turn would be needed to suggest that momentum is stabilising.
Lagging Quadrant
Communication Services (XLC) and Technology (XLK) remain in Lagging. Both are left of the vertical axis and below the horizontal midpoint, indicating weak relative strength and negative momentum. Neither has established a rotation toward Improving.
Communication Services is positioned deep in the lower-left quadrant, although it is closer to the centre than Technology. Its latest position remains well below and left of the midpoint lines. A sustained upward and rightward path would be required to signal a rotation toward Improving.
Technology is the more pronounced laggard, positioned further left and lower than Communication Services. Its latest point remains firmly in Lagging, despite fluctuations along its recent trail. A meaningful recovery would require sustained upward movement followed by progress toward the vertical axis. Until that occurs, the sector’s relative momentum configuration remains weak.
Bottom Line
The 6 November 2026 chart shows eight sectors in Leading, Energy in Weakening, and Communication Services and Technology in Lagging, with none in Improving. Industrials remains in Leading near the central reference area, while Real Estate, Financials and Health Care show elevated positive positioning. Energy’s position below the horizontal axis signals deteriorating momentum despite positive relative strength. Technology is the clearest laggard, with Communication Services also weak. Subsequent tail direction will show whether leaders retain their advantage, Energy weakens further, and the two lagging sectors recover toward Improving.


 Nov 09, 2026




 Please wait processing your request...