 CA
CA
 NZ
NZ
 UK
UK
 AU
AU
 IND
IND

 US
US


…
Obsidian Therapeutics, Inc. operates as a clinical-stage biotechnology company developing engineered cell and gene therapies. The company is developing investigational therapies, including OBX-115, which is being evaluated in clinical trials for advanced solid tumors, advanced melanoma, and relapsed refractory non-small cell lung cancer. It utilizes a proprietary Cytodriver technology platform designed to regulate protein function using FDA-approved small-molecule drugs and is advancing tumor-infiltrating lymphocyte (TIL) cell therapies that leverage mbIL15 to enhance persistence, antitumor activity, and clinical safety. Access to investigational therapies is currently limited to participation in clinical trials, and the company collaborates with other organizations to apply its platform technology. The company was founded in 2015 and is based in Cambridge, Massachusetts.
Source: TradingView
The charts and visual representations are sourced from TradingView through embedded widgets. For any issues with chart display, please visit the TradingView website
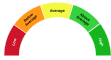
A unique technical analysis driven score developed by Kalkine showing momentum in stock prices based on select technical indicators identified.


| Breakdown | 2025-12-31 | 2024-12-31 |
|---|---|---|
| Type | yearly | yearly |
| Date | 2025-12-31 | 2024-12-31 |
| Income before tax | -100.61M | -83.11M |
| Net income | -100.61M | -83.11M |
| Selling general administrative | 19.55M | 18.07M |
| Reconciled depreciation | 1.48M | 1.53M |
| Operating income | -105.67M | -91.25M |
| Tax provision | 0.00M | 0.00M |
| Interest income | 5.06M | 8.15M |
| Net interest income | 5.06M | 8.15M |
| Total revenue | 0.00M | 0.00M |
| Total operating expenses | 105.67M | 91.25M |
| Net income from continuing ops | -100.61M | -83.11M |
| Breakdown | 2025-12-31 | 2024-12-31 |
|---|---|---|
| Type | yearly | yearly |
| Date | 2025-12-31 | 2024-12-31 |
| Total assets | 88.58M | 183.71M |
| Other current assets | 1.03M | 4.58M |
| Total liab | 354.62M | 358.14M |
| Total stockholder equity | -266.04M | -174.43M |
| Other current liab | 1.42M | 0.98M |
| Capital stock | 0.00M | 0.00M |
| Retained earnings | -295.94M | -195.33M |
| Cash | 40.41M | 49.76M |
| Total current liabilities | 15.36M | 16.09M |
| Total current assets | 81.52M | 172.85M |
| Short term investments | 40.08M | 118.51M |
| Accounts payable | 0.01M | 1.82M |
| Non currrent assets other | 1.00M | 1.00M |
| Non current assets total | 7.06M | 10.87M |
| Capital lease obligations | 4.28M | 6.81M |
| Breakdown | 2025-12-31 | 2024-12-31 | 2022-12-31 | 2021-12-31 | 2020-12-31 |
|---|---|---|---|---|---|
| Type | yearly | yearly | yearly | yearly | yearly |
| Date | 2025-12-31 | 2024-12-31 | 2022-12-31 | 2021-12-31 | 2020-12-31 |
| Investments | 81.09M | -53.09M | - | - | - |
| Total cash from financing activities | 0.02M | 162.51M | - | - | - |
| Net income | -100.61M | -83.11M | -62.22M | -80.53M | -74.22M |
| Change in cash | -9.36M | 33.64M | - | - | - |
| Begin period cash flow | 50.77M | 17.13M | - | - | - |
| End period cash flow | 41.41M | 50.77M | 17.13M | - | - |
| Total cash from operating activities | -90.39M | -75.00M | - | - | - |
| Issuance of capital stock | 0.00M | 160.50M | - | - | - |
| Depreciation | 1.48M | 1.53M | - | - | - |
| Capital expenditures | 0.07M | 0.78M | 0.00M | 0.00M | 0.00M |
| Change in working capital | 2.56M | 1.75M | - | - | - |
| Stock based compensation | 8.93M | 7.06M | - | - | - |
| Other non cash items | -0.14M | -0.02M | - | - | - |
| Free cash flow | -90.47M | -75.78M | - | - | - |
Sector: Healthcare Industry: Biotechnology
|
Stock Name
|
Change
(USD) |
Price
(USD) |
Trailing
PE (x) |
Forward
PE (x) |
Price Sales
TTM (x) |
Price to Book Value (x)
|
|---|---|---|---|---|---|---|
| OBX Obsidian Therapeutics, Inc. Common Stock |
-0.55 4.10% |
12.86 | - | - | - | - |
| NVO Novo Nordisk A/S |
0.18 0.47% |
38.80 | 41.58 | 31.15 | 2.13 | 32.99 |
| VRTX Vertex Pharmaceuticals Inc |
3.81 0.73% |
526.19 | 30.22 | 24.27 | 10.36 | 6.50 |
| REGN Regeneron Pharmaceuticals Inc |
-7.98 1.00% |
788.04 | 29.07 | 20.12 | 7.57 | 3.82 |
| ARGNF argenx SE |
- -% |
1010.26 | 45.77 | 31.25 | 13.84 | 7.12 |
Obsidian Therapeutics, Inc. operates as a clinical-stage biotechnology company developing engineered cell and gene therapies. The company is developing investigational therapies, including OBX-115, which is being evaluated in clinical trials for advanced solid tumors, advanced melanoma, and relapsed refractory non-small cell lung cancer. It utilizes a proprietary Cytodriver technology platform designed to regulate protein function using FDA-approved small-molecule drugs and is advancing tumor-infiltrating lymphocyte (TIL) cell therapies that leverage mbIL15 to enhance persistence, antitumor activity, and clinical safety. Access to investigational therapies is currently limited to participation in clinical trials, and the company collaborates with other organizations to apply its platform technology. The company was founded in 2015 and is based in Cambridge, Massachusetts.

1030 Massachusetts Avenue, Cambridge, MA, United States, 02138

(781) 806-6245

87
| Name | Title | Year Born |
|---|---|---|
| Dr. Maria Fardis M.B.A., Ph.D. | Executive Chairman of the Board | 1968 |
| Dr. Madan Jagasia M.D., M.S. | President, CEO & Director | 1970 |
| Mr. Dana M. Alexander M.B.A. | Chief Technical Officer | 1976 |
| Dr. Parameswaran Hari M.D., M.S. | Chief Medical Officer | 1968 |
| Ms. Julie B. Feder | Chief Financial Officer | 1971 |
| Caroline Code | Vice President of Corporate Development & Investor Relations | NA |
| Ms. Jennifer H. Peterson | Chief People Officer | 1967 |
| Dr. Peter Barrett Ph.D. | Secretary & Director | 1953 |
Disclaimer - (*)This information, including any data, is sourced from Unicorn Data Services SAS, trading as EOD Historical Data (“EODHD”) on an ‘as is’ basis, using their API. We cannot guarantee the completeness or validity of the information and data provided on this page, as well as via the API. In some cases, the data may include analyst ratings or recommendations sourced through the EODHD API, which are intended solely for general information purposes.
This information does not consider your personal objectives, financial situation, or needs. Kalkine is not liable for any errors or omissions in the information provided or for any actions taken in reliance on it. You should seek advice from a financial adviser, stockbroker or other professional adviser (including taxation and legal advice) as necessary before acting on this information.

Download a free report with stock ideas and industry insights for general information.
Download Free Report Now →


Basic Materials
 +0.18%
Communication Services
+0.02%

Consumer Cyclical
+0.43%

Consumer Defensive
+0.03%

Energy
 -0.27%

Financial Services
+0.32%
Financials
-0.23%

Healthcare
-0.17%

Industrials
+0.45%

Real Estate
-0.02%

Technology
+0.20%

Utilities
+0.20%
Note: Daily price change (%) by sector excluding stocks with +/-90% daily price change. Companies above $500 million market capitalization are considered.
 Portfolio
 Watchlist

 Please wait processing your request...