
1. Dutch Bros Inc. (NYSE: BROS)
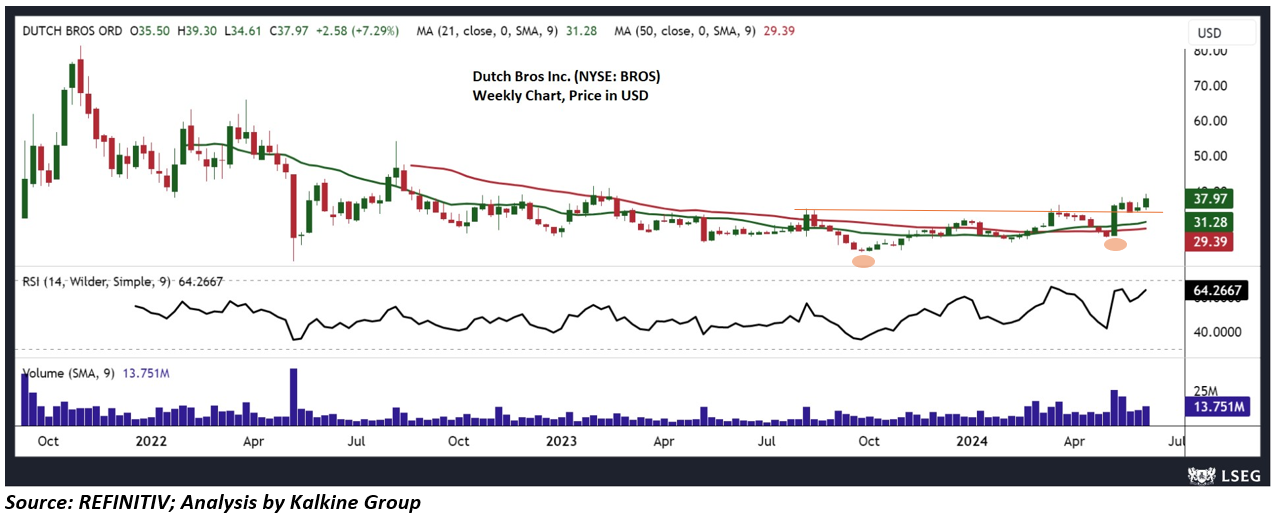
Dutch Bros Inc. (NYSE: BROS) is an operator and franchiser of drive-thru shops, which is focused on serving hand-crafted beverages. The Company sells a range of customizable hot, iced and blended beverages. Coffee-based beverages include its espresso-based custom drinks, cold brew and its proprietary Freeze blended beverages.
Dutch Bros, a coffee company, has announced its Q1 2024 financial results, which were exceptional. The company saw system same shop sales growth reach 10.0%, the strongest single quarter since Q4 2021, and revenue grew significantly, reaching $275 million, a 39% YoY increase. The company's performance was driven by strong sales growth, excellent margin flow through, and the successful launch of new products. Additionally, 45 new shops opened, and the company revised its guidance for 2024, with total system shop openings expected to remain in the range of 150 to 165. Overall, Dutch Bros' CEO expressed confidence in the company's ability to continue delivering exceptional results despite a volatile economic backdrop.
Technical View: BROS' stock has undergone a significant consolidation phase in recent past, with the stock price showing resilience at its lower levels and marking higher lows on the weekly chart. Subsequently, the stock has breached the trendline resistance zone and made a higher high, indicating a possibility of an upside move in the near term. This change in behaviour suggests a substantial increase in buying pressure and investor confidence. The Relative Strength Index (RSI) remains in a positive zone, reinforcing the ongoing upward momentum. Additionally, the stock is currently trading above both the 21-day and 50-day Simple Moving Averages (SMAs), which could serve as a foundation for future price stability and potentially limit losses.
2. Oscar Health, Inc. (NYSE: OSCR).
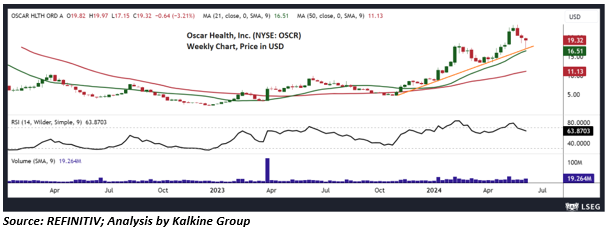
Oscar Health, Inc. (NYSE: OSCR) is a health insurance company, which has built a full stack technology platform focused on serving its members. It offers individual and family, and small group plans, and +Oscar, its full stack technology platform, to others within the provider and payor space.
Oscar Health, Inc. has released its Q1 2024 financial results, which demonstrate improvements across all key metrics. The company reported a 46% YoY increase in total revenue, driven by higher membership, rate increases, and lower risk adjustment. The Medical Loss Ratio improved by 210 basis points to 74.2%, while the SG&A Expense Ratio decreased by 870 basis points to 18.4%. As a result, Oscar Health's Adjusted EBITDA reached $219.3 million, and the net income attributable to Oscar increased by $217.1 million YoY, resulting in diluted earnings per share of $0.62. The CEO of Oscar Health, Mark Bertolini, is optimistic about the company's strong performance.
Technical View: OSCR's stock has exhibited remarkable strength and resilience on its weekly chart, consistently setting new highs and lows. The stock's price is now hovering near critical trendline support levels, indicating a high likelihood of further upside movement in the short term. This upward momentum suggests a strong potential for further growth and increased value soon. The Relative Strength Index (RSI), which is calculated over a 14-period moving average, is currently trading in positive territory, further supporting the positive bias. Additionally, the stock is currently trading above its 21-period and 50-period Simple Moving Averages (SMAs), reinforcing the positive outlook.
Note 1: How to Read the Charts?
The Green colour line reflects the 21-period moving average while the red line indicates the 50-period moving average. SMA helps to identify existing price trends. If the prices are trading above the 21-period and 50-period moving average, then it shows prices are currently trading in a bullish trend.
The Black colour line in the chart’s lower segment reflects the Relative Strength Index (14-Period) which indicates price momentum and signals momentum in trend. A reading of 70 or above suggests overbought status while a reading of 30 or below suggests an oversold status.
The Blue colour bars in the chart’s lower segment show the volume of the stock. The volume is the number of shares that changed hands during a given day. Stocks with high volumes are more liquid than stocks with lesser volume and liquidity in stocks helps in easier and faster execution of the order.
The Orange colour lines are the trend lines drawn by connecting two or more price points and used for trend identification purposes. The trend line also acts as a line of support and resistance.
Technical Indicators Defined: -
Support: A level at which the stock prices tend to find support if they are falling, and a downtrend may take a pause backed by demand or buying interest.
Resistance: A level at which the stock prices tend to find resistance when they are rising, and an uptrend may take a pause due to profit booking or selling interest.
_06_27_2026_21_16_35_168117.jpg)


 Please wait processing your request...