
 CA
 NZ
 UK
 AU
 IND

 US

 Share
 X (Formerly Twitter)
 Whatsapp
 Facebook
 LinkedIn
 Telegram
 Email This Article
 Copy Link
 Summarize with AI
 Chat GPT
 Perplexity

Today's session showed a mixed but broadly constructive picture across thematic and commodity ETFs. The iShares PHLX Semiconductor ETF (SOXX) and Roundhill Memory ETF (DRAM) both posted strong single-day gains after multi-week pullbacks, while the Defiance Quantum ETF (QTUM) continued to drift lower within its post-June consolidation range. On the commodities side, SPDR Gold Shares (GLD), iShares Silver Trust (SLV), and the Global X Copper Miners ETF (COPX) all bounced off well-defined support zones, though each remains in a longer-term corrective structure after sharp rallies earlier in the year.
iShares PHLX Semiconductor ETF (SOXX) — Reversal Candle Off the Highs, RSI Momentum Still Fading
Key Highlights
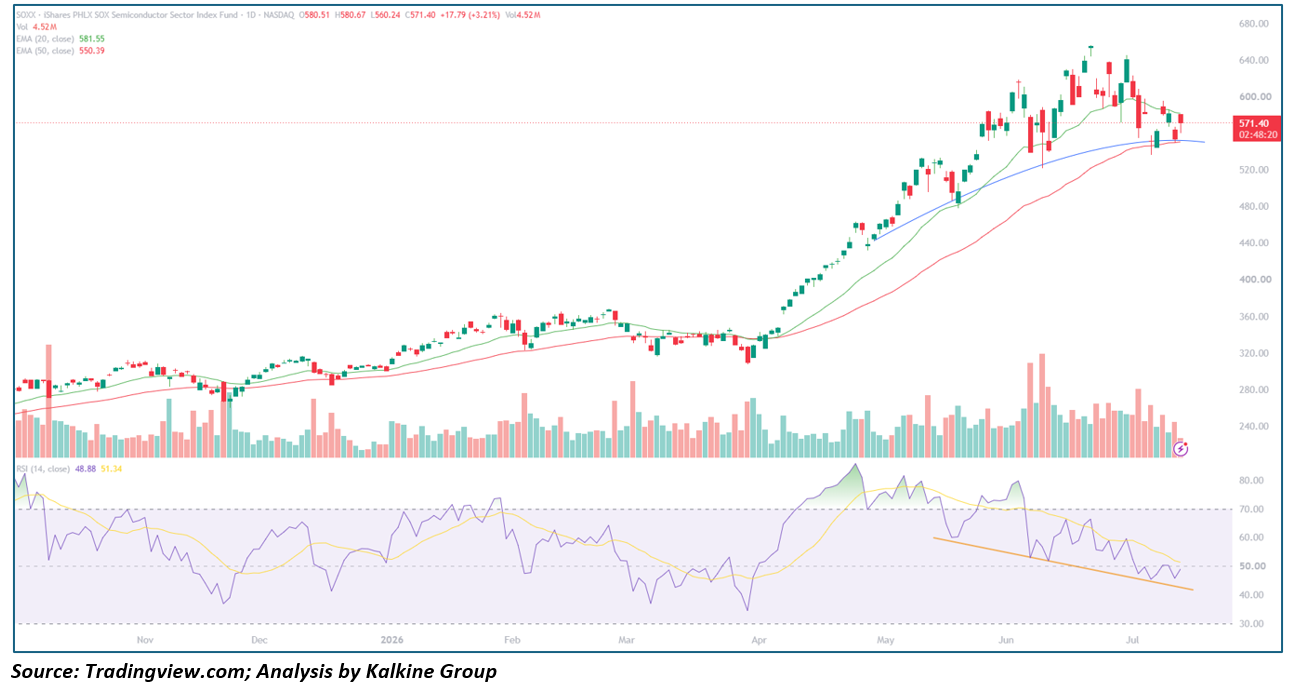
- SOXX trading at $571.40, up 3.21% ($17.79) on volume of 4.52M shares, after ranging between $560.24 and $580.67.
- Price closed below the 20-day EMA ($581.55) but remains above the 50-day EMA ($550.39).
- RSI sits at roughly 48.9, with the signal line at 51.3 — below the midline and tracking a descending trendline drawn from the overbought readings seen in May and June.
- SOXX climbed steadily from around $270 in October 2025 to roughly $330 by April, then broke out sharply into a peak near $655 in June before entering a multi-week pullback.
- Today's session opened near the highs, sold off toward $560, and recovered to close well up on the day — a choppy, indecisive candle rather than a clean reversal.
Trend Structure SOXX's chart shows a long, orderly base through the back half of 2025, followed by an explosive breakout from April into June that more than doubled the fund's value. Since the June peak, price has been consolidating in a wide band between the two EMAs, and the RSI's persistent downtrend — even as price holds up reasonably well — points to fading momentum beneath the surface.
Key Technical Levels
Resistance
- $581.55 – 20-day EMA
- $600.00 – Round-number resistance
- ~$655.00 – June 2026 high
Support
- $560.24 – Today's low
- $550.39 – 50-day EMA
- $530.00 – Prior consolidation zone
Outlook SOXX needs to reclaim the 20-day EMA and turn the RSI's downtrend around to confirm the correction from June's highs is complete. Continued underperformance in momentum despite a firm price floor is worth watching closely — that kind of divergence often precedes further chop rather than a clean breakout.
Roundhill Memory ETF (DRAM) — Sharp Bounce Off the 50-Day EMA After a Steep Pullback From June's Peak
Key Highlights
- DRAM trading at $61.32, up 7.02% ($4.02) on volume of 54.24M shares, after ranging between $59.02 and $61.66.
- Price remains below the 20-day EMA ($64.53) but has reclaimed ground above the 50-day EMA ($58.19).
- RSI has recovered to roughly 47.3, with the signal line at 51.4, rebounding after cooling from overbought territory reached in late May and June.
- DRAM rallied from around $24 in late April to a peak near $80 in late June — more than tripling in under two months — before correcting sharply into current levels.
- Today's gain is among the strongest single-day moves since the pullback began.
Trend Structure DRAM's advance has been one of the most explosive in this group, a nearly uninterrupted climb from its April base to its June top. The subsequent pullback has been proportionally steep as well, but today's decisive bounce off the 50-day EMA — on very heavy volume — suggests buyers are stepping back in at a logical support level. 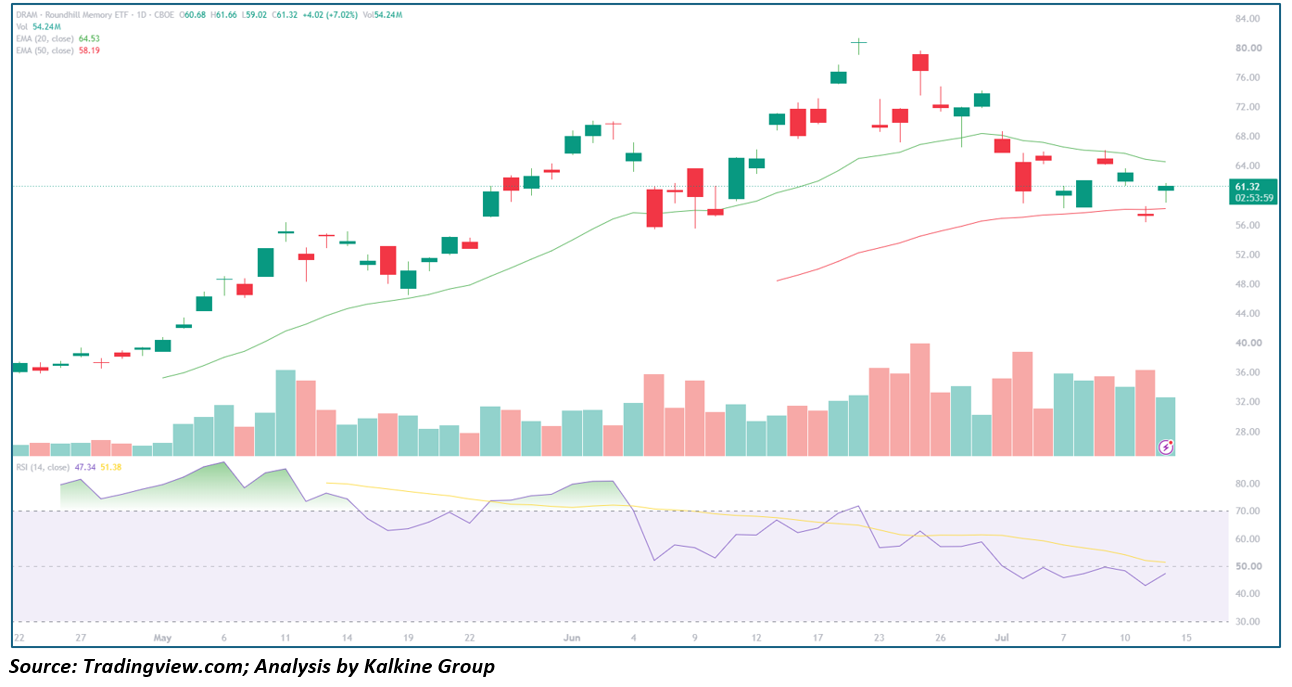
Key Technical Levels
Resistance
- $64.53 – 20-day EMA
- ~$80.00 – Late-June 2026 high
Support
- $59.02 – Today's low
- $58.19 – 50-day EMA
Outlook A confirmed close back above the 20-day EMA would support the case that the correction from June's highs is largely finished. Losing the 50-day EMA would instead point to a deeper retracement back toward the mid-$50s.
Defiance Quantum ETF (QTUM) — Drifting Lower Within a Post-June Range, Testing the 50-Day EMA
Key Highlights
- QTUM trading at $150.02, up 0.67% ($1.00) on volume of 127.41K shares, after ranging between $149.09 and $151.62.
- Price sits just below both the 20-day EMA ($155.96) and the 50-day EMA ($151.17).
- RSI is at roughly 43.7, with the signal line at 45.2, holding below the midline after cooling from overbought levels above 80 in May and June.
- QTUM rallied from a base near $100 in early April to a high of $173.68 in June, and has since drifted lower inside a defined range bounded by $145 on the downside and $160–173 on the upside.
- Today's move is a modest, low-conviction bounce rather than a decisive reversal.
Trend Structure QTUM's chart shows a powerful, fast advance off its April lows, followed by nearly two months of range-bound trading beneath the June high. Unlike SOXX and DRAM, today's price action shows no real urgency — the fund is quietly grinding toward the lower end of its recent range and is now testing the 50-day EMA from below. 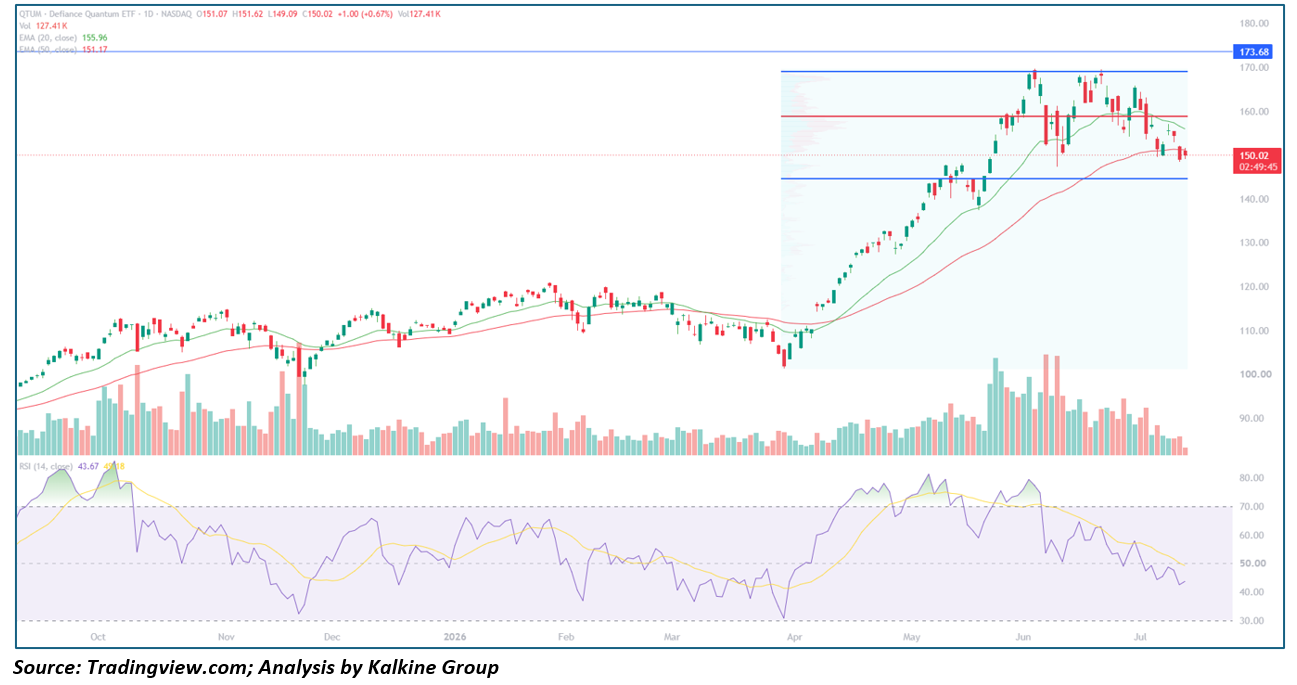
Key Technical Levels
Resistance
- $151.17 – 50-day EMA
- $155.96 – 20-day EMA
- $160.00 – Range midpoint
- $173.68 – June 2026 high
Support
- $149.09 – Today's low
- $145.00 – Lower boundary of the post-June range
Outlook QTUM's range is well-defined: a break below $145 would signal the post-June consolidation is resolving lower, while reclaiming the 20-day EMA near $156 would put the June highs back in play. For now, the fund is stuck in the middle, with momentum leaning slightly bearish.
SPDR Gold Shares (GLD) — Bouncing Off Support After a Prolonged Slide From February's Spike High
Key Highlights
- GLD trading at $372.27, up 1.40% ($5.14) on volume of 4.36M shares, after ranging between $372.20 and $376.28.
- Price remains below both the 20-day EMA ($379.25) and the 50-day EMA ($394.80).
- RSI has ticked up to roughly 41.5, with the signal line at 38.0, still below the midline but recovering from oversold conditions.
- GLD rallied from around $300 in September 2025 to a sharp spike peak near $505 in February 2026, then entered a persistent downtrend that has carried price back to current levels.
- Today's bounce comes directly off a horizontal support shelf near $362 that has held on multiple tests since June.
Trend Structure GLD's chart is dominated by a parabolic spike into February followed by a long, grinding decline — the fund has given back a substantial portion of its earlier gains over the following five months. Both EMAs are sloped downward, and price has stayed beneath them for an extended stretch, the clearest bearish structure in this group. 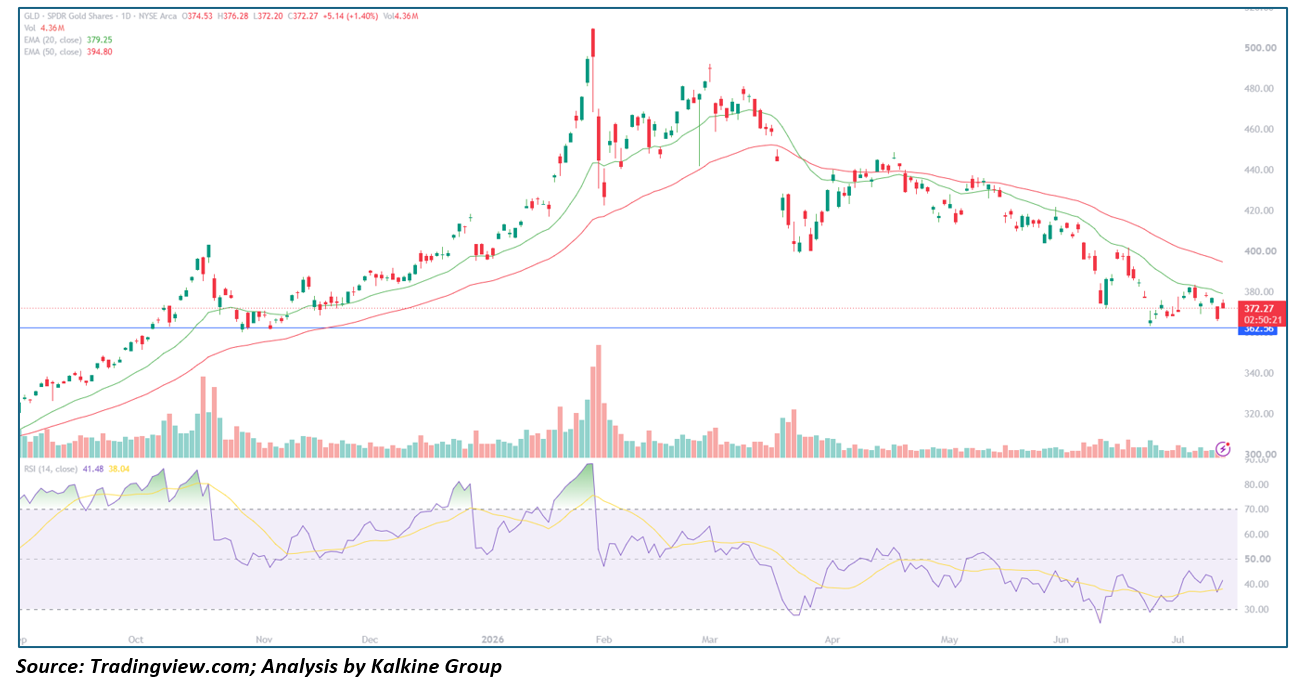
Key Technical Levels
Resistance
- $379.25 – 20-day EMA
- $394.80 – 50-day EMA
- ~$505.00 – February 2026 spike high
Support
- $372.20 – Today's low
- ~$362.00 – Horizontal support shelf
Outlook GLD remains in a well-established downtrend, and today's bounce looks more like a support test than a reversal. A sustained close back above the 20-day EMA would be the first sign the multi-month slide is stabilizing; a break of the $362 shelf would open the door to a retest of levels last seen before the February spike.
iShares Silver Trust (SLV) — Testing the Lower Boundary of a Multi-Month Descending Channel
Key Highlights
- SLV trading at $52.99, up 1.59% ($0.83) on volume of 9.3M shares, after ranging between $52.97 and $53.94.
- Price remains well below both the 20-day EMA ($55.79) and the 50-day EMA ($60.67).
- RSI sits at roughly 38.2, with the signal line at 35.0, still in weak territory despite today's uptick.
- SLV spiked from a steady climb to a peak near $108 in late January/early February 2026, then collapsed into a descending channel that has guided price lower ever since.
- Today's session bounced directly off the lower boundary of that channel.
Trend Structure SLV's chart shows one of the sharpest blow-off tops in this group, followed by a textbook descending channel that has contained nearly every swing since February. Price has now tagged the bottom of that channel multiple times in recent weeks, and today's bounce is another test of that same support line. 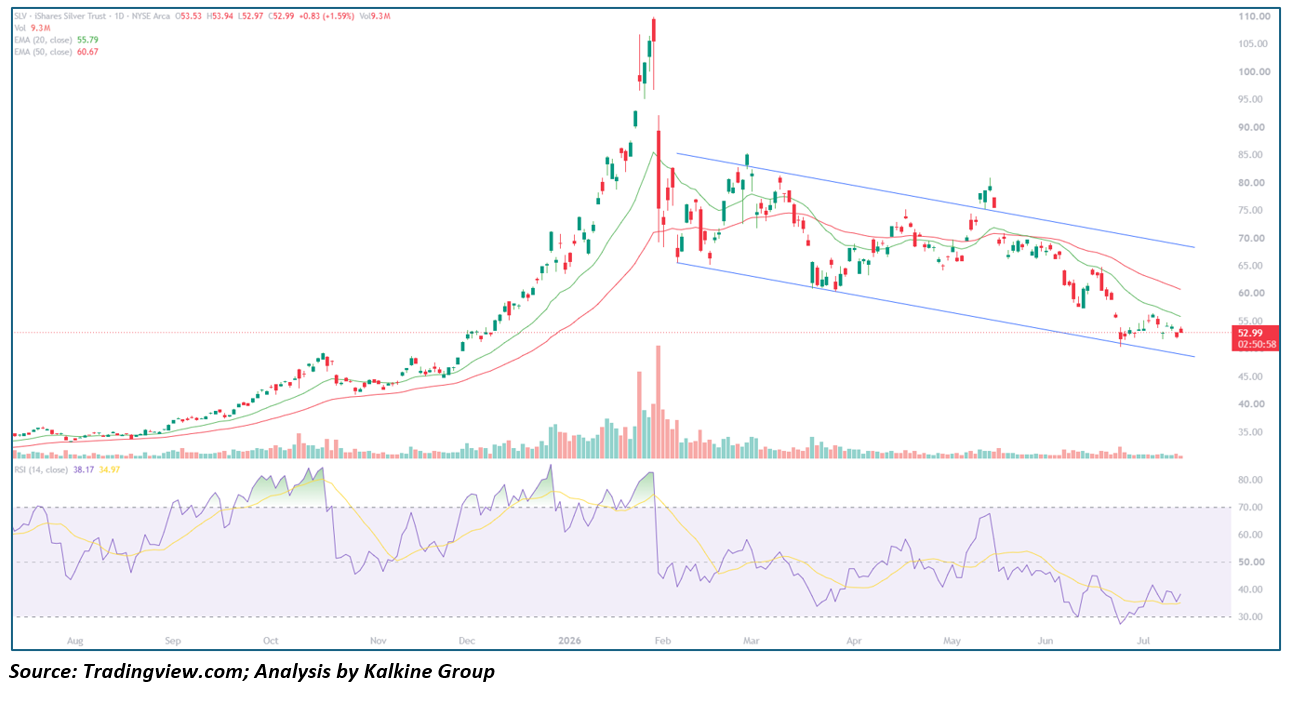
Key Technical Levels
Resistance
- $55.79 – 20-day EMA
- $60.67 – 50-day EMA
- Upper channel trendline (currently ~$70–75)
Support
- $52.97 – Today's low / lower channel trendline
- ~$52.00 – Recent multi-week lows
Outlook As long as SLV holds the lower boundary of its descending channel, near-term bounces like today's remain possible. A decisive break below that trendline would suggest the downtrend is accelerating, while a break above the upper channel line and the 50-day EMA would be needed to argue the broader corrective structure is over.
Global X Copper Miners ETF (COPX) — Bouncing Off the Lower End of a Five-Month Trading Range
Key Highlights
- COPX trading at $78.03, up 4.95% ($3.68) on volume of 1.81M shares, after ranging between $77.42 and $79.18.
- Price is essentially at the 20-day EMA ($78.06) and remains below the 50-day EMA ($80.42).
- RSI has risen to roughly 48.4, with the signal line at 41.1, recovering from a multi-week slide below the midline.
- COPX rallied from around $38 in August 2025 to a spike high near $99 in January 2026, then settled into a broad trading range roughly between $72 and $92 that has persisted for five months.
- Today's strong gain comes off a recent test of the lower part of that range.
Trend Structure COPX's advance into January was steep and sustained, but since then the fund has been range-bound rather than trending, oscillating between a $72 floor and a $92 ceiling with a mid-range pivot near $84. Today's bounce lifts price back toward the 20-day EMA after a slide toward the lower third of the range. 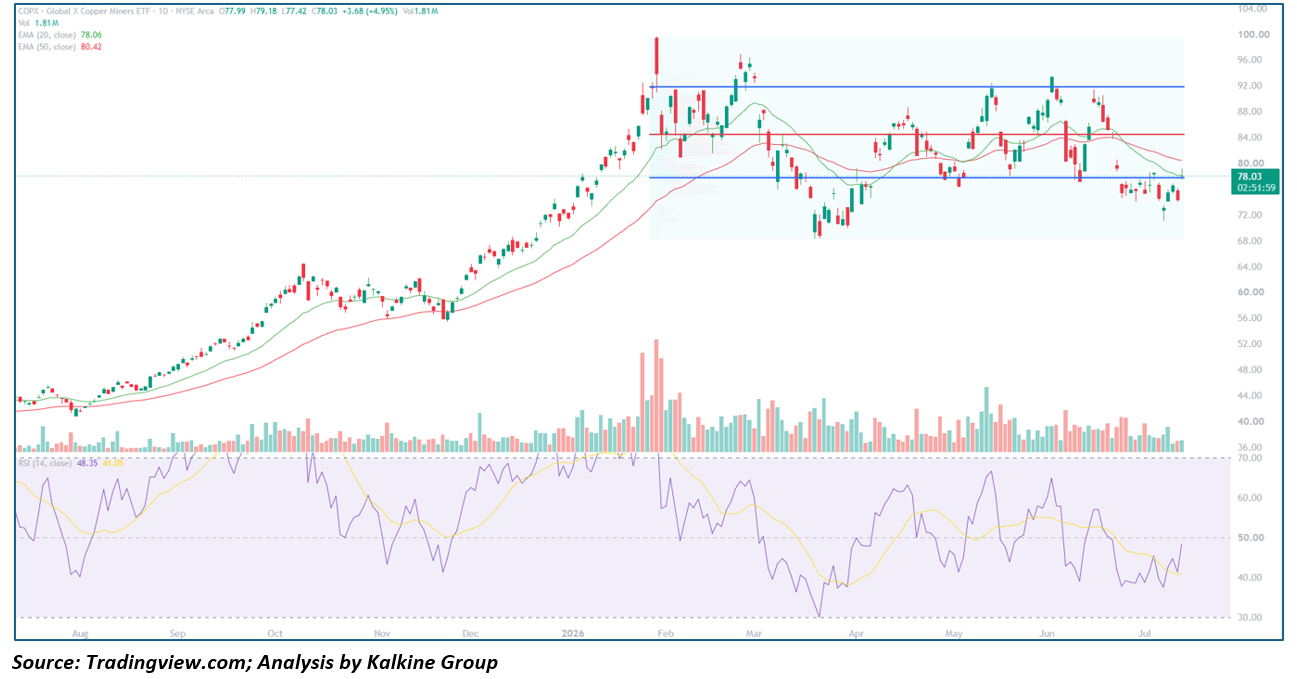
Key Technical Levels
Resistance
- $80.42 – 50-day EMA
- $84.00 – Range midpoint
- $92.00 – Upper boundary of the trading range
Support
- $77.42 – Today's low
- $72.00 – Lower boundary of the trading range
Outlook COPX remains locked in its multi-month range. Reclaiming the 50-day EMA and the $84 pivot would suggest a move back toward the top of the range, while a break below $72 would mark the first real technical damage to the range-bound structure that's held since February.
This analysis is based on daily chart technical indicators (20/50-day EMAs, RSI-14) and price action as of July 14, 2026, and is intended for informational purposes only — not investment advice.


 Nov 16, 2026





 Please wait processing your request...