
 CA
 NZ
 UK
 AU
 IND

 US

 Share
 X (Formerly Twitter)
 Whatsapp
 Facebook
 LinkedIn
 Telegram
 Email This Article
 Copy Link
 Summarize with AI
 Chat GPT
 Perplexity

Key Highlights
- Six Sectors Occupy Leading: Industrials (XLI), Financials (XLF), Consumer Discretionary (XLY), Real Estate (XLRE), Health Care (XLV) and Utilities (XLU) are positioned in the Leading quadrant, indicating positive relative strength and momentum.
- Utilities Enters Leading: XLU has moved into the Leading quadrant, reflecting an improvement in its relative momentum and a transition from its previous Weakening position.
- Communication Services Shows Strong Recovery: XLC remains in Improving, with a pronounced upward trajectory indicating strengthening momentum despite negative relative strength.
- Materials and Consumer Staples Remain in Weakening: XLB and XLP occupy the Weakening quadrant, indicating positive relative strength but negative momentum.
- Energy and Technology Remain in Lagging: XLE and XLK continue to display negative relative strength and momentum, highlighting persistent underperformance.
- Leadership Broadens: Six of the eleven sectors are now in Leading, suggesting a broader concentration of positive relative momentum, although significant weakness remains in Energy and Technology.
The US sector relative performance chart dated 13 November 2026 shows an improved momentum configuration, with six of the eleven sectors positioned in Leading, two in Weakening, one in Improving and two in Lagging. Industrials (XLI), Financials (XLF), Consumer Discretionary (XLY), Real Estate (XLRE), Health Care (XLV) and Utilities (XLU) occupy the Leading quadrant, indicating positive relative strength and momentum against the broader market. Utilities' transition into Leading represents an improvement from its previous Weakening classification.
Communication Services (XLC) remains the only sector in Improving, displaying a particularly strong upward trajectory. Materials (XLB) and Consumer Staples (XLP) remain in Weakening, while Energy (XLE) and Information Technology (XLK) continue to occupy Lagging.
The historical trails provide additional context beyond the latest quadrant positions. XLC has advanced substantially from deeply negative relative momentum into positive momentum territory, making it the clearest recovery candidate. XLU has crossed into Leading, while the established Leadership group maintains positive relative strength and momentum. Conversely, XLE remains at an extreme negative momentum reading despite its upward turn, and XLK continues to exhibit weak relative performance. These movements highlight a selective but broader improvement in US sector leadership.
Momentum Breakdown by Sector
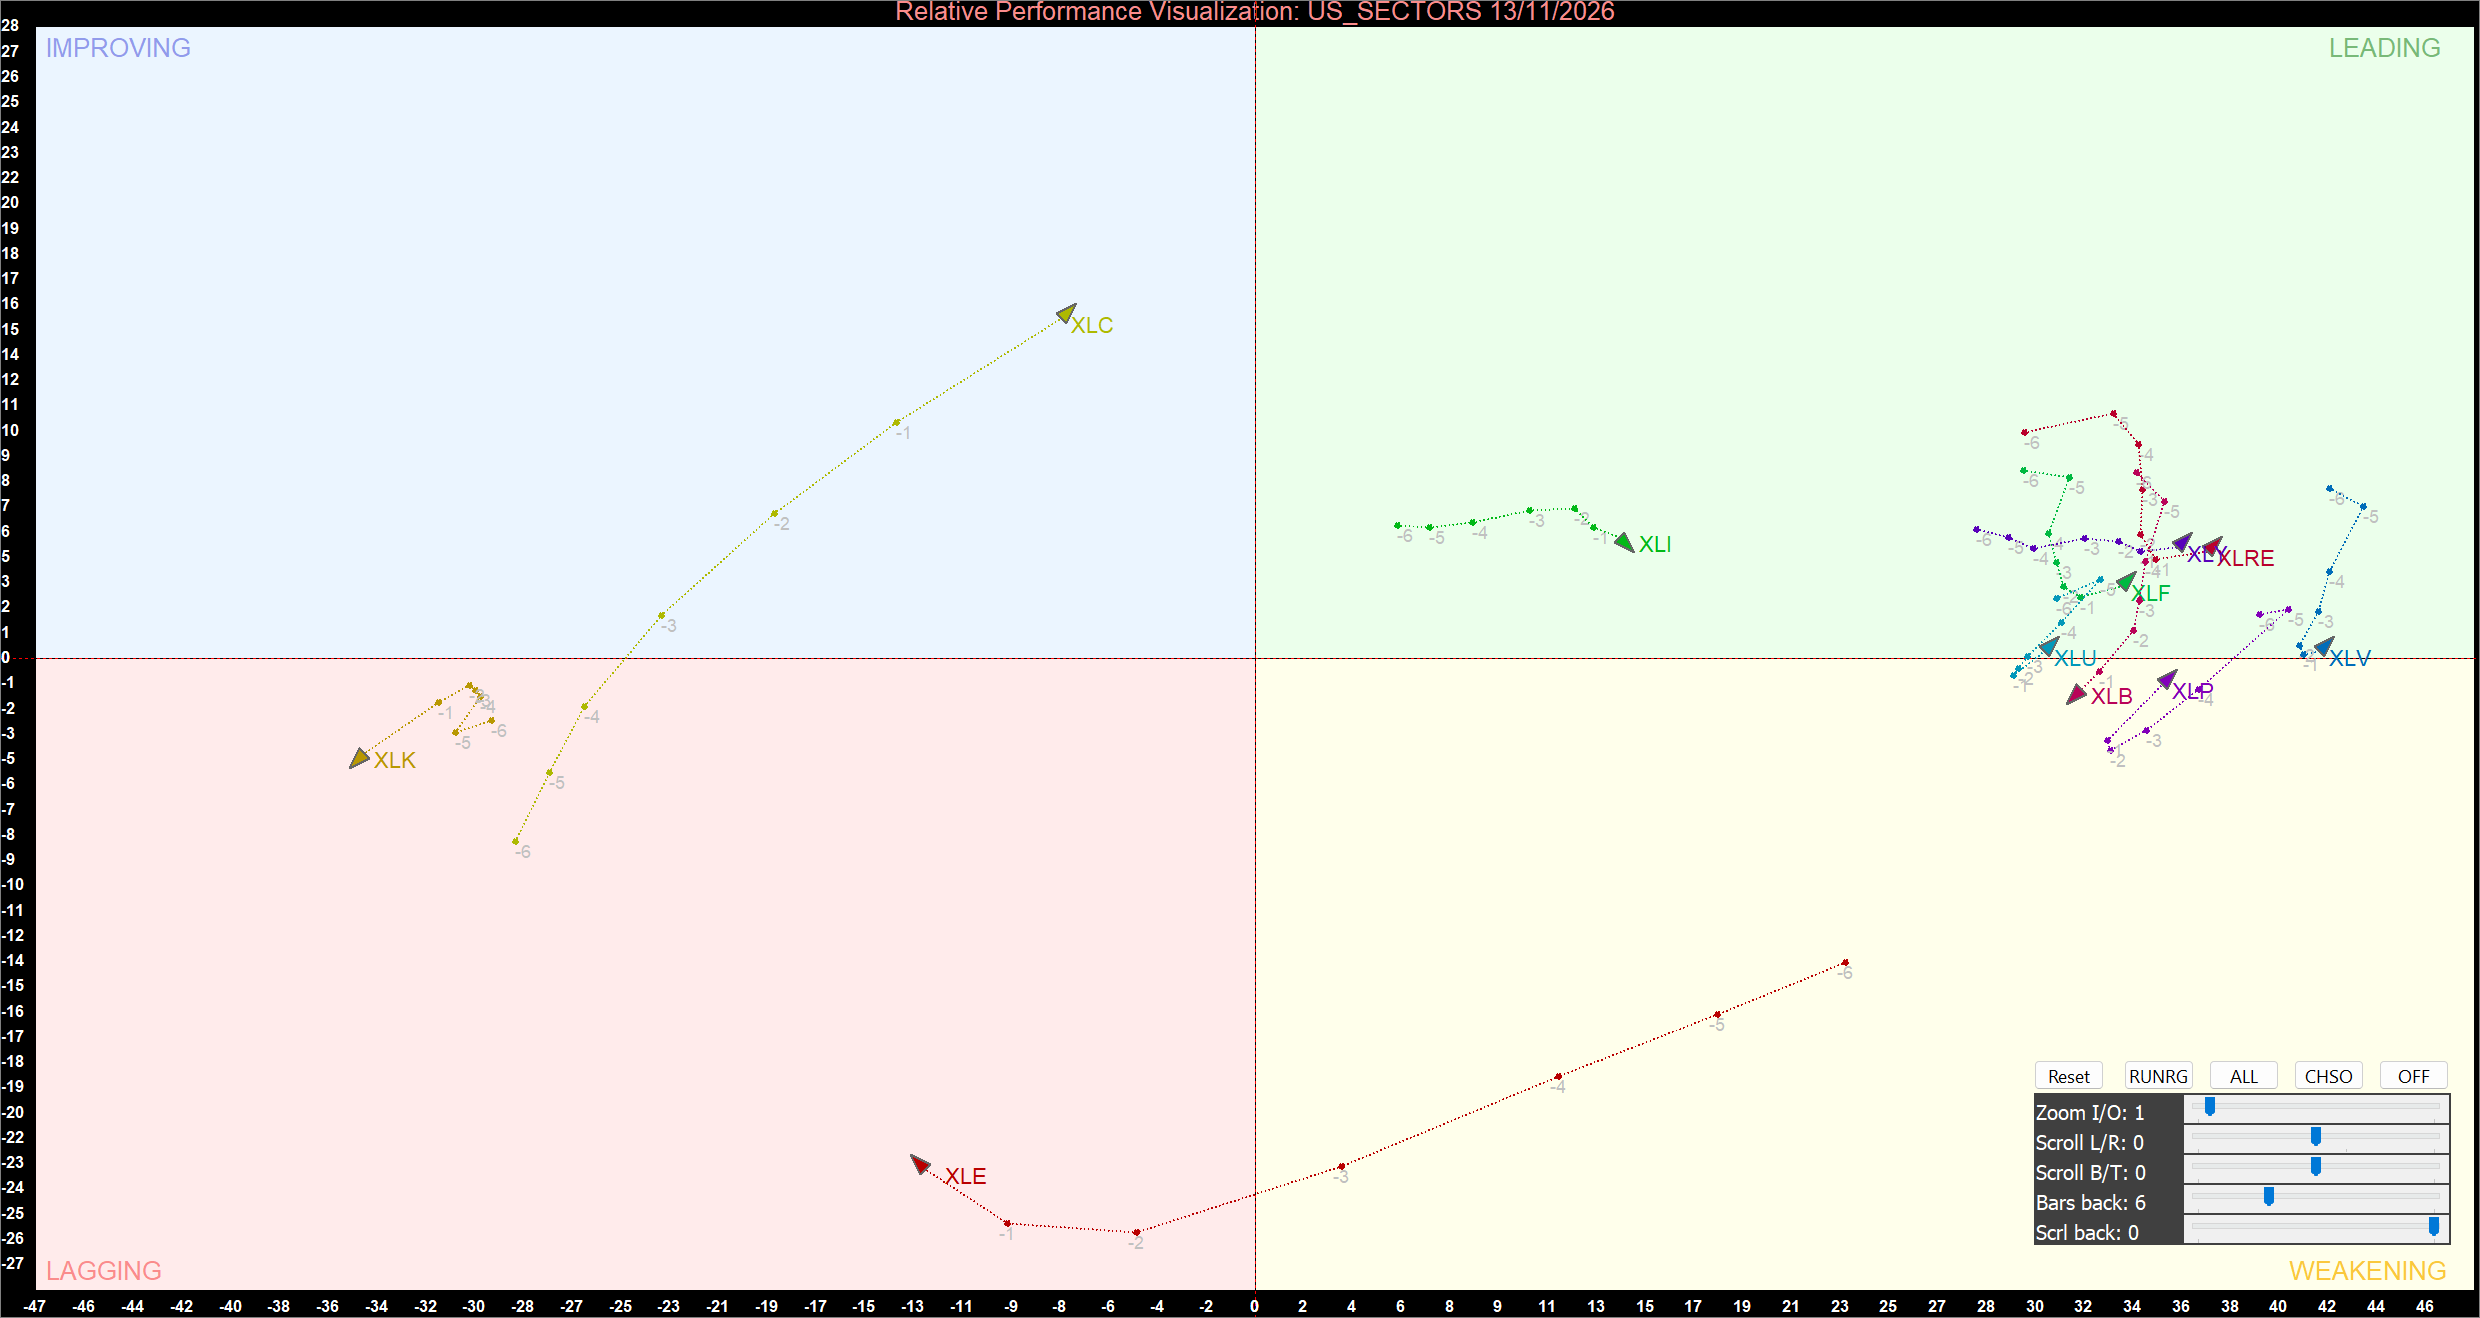
US Sector Relative Momentum Chart at the closing price of 13/11/2026. Powered by: AmiBroker.com.
Leading and Improving Sectors Show Broader Momentum Strength
Industrials (XLI) remains positioned in the Leading quadrant and continues to demonstrate positive relative strength and momentum. Its latest plotted point, however, shows some moderation following an extended period at positive momentum levels. The sector remains comfortably above the horizontal reference line, suggesting that its relative performance remains constructive despite the recent easing in momentum.
Financials (XLF), Consumer Discretionary (XLY) and Real Estate (XLRE) also occupy Leading. Their positions in the upper-right quadrant indicate that relative strength and momentum remain positive. Although their historical trails show some fluctuations and moderation, their latest endpoints remain within positive territory. This suggests that these sectors continue to maintain their relative leadership, although the direction of their subsequent trails will be important in assessing whether momentum can accelerate further.
Health Care (XLV) is also positioned in Leading, with its latest endpoint relatively close to the horizontal reference boundary. While the sector retains positive relative strength and momentum, its proximity to the boundary suggests that its momentum advantage is comparatively limited. A sustained move lower could signal a potential transition into Weakening.
Utilities (XLU) has made an important transition from Weakening into Leading. Its latest position above the horizontal axis and to the right of the vertical boundary indicates that both relative strength and momentum have turned positive. This transition strengthens the leadership group and suggests that defensive sector performance is improving relative to the broader market. Continued movement within the upper-right quadrant would reinforce this positive momentum configuration.
Communication Services (XLC) remains the only sector in Improving. Its trail has advanced sharply from deeply negative relative momentum into positive momentum territory, while relative strength remains below the vertical zero boundary. This combination indicates that momentum is improving even though the sector has not yet regained relative outperformance. A continued upward and rightward movement would strengthen the possibility of a transition into Leading. The strength of its recent trajectory makes XLC the clearest recovery candidate on the chart.
Weakening and Lagging Sectors Face Persistent Relative Pressure
Materials (XLB) and Consumer Staples (XLP) remain positioned in the Weakening quadrant. Both sectors retain positive relative strength but have negative momentum readings, indicating that their relative performance has deteriorated despite remaining above the vertical zero boundary. Their latest positions suggest that momentum has moderated, although neither sector has experienced a transition into Lagging.
Materials is positioned relatively close to the horizontal reference boundary, indicating a comparatively limited negative momentum reading. Its current location suggests that the sector could potentially recover into Leading if momentum improves and its trajectory moves above the horizontal axis. However, continued downward movement would increase the possibility of further deterioration.
Consumer Staples is also positioned in Weakening, with its latest endpoint below the horizontal boundary. Its trajectory indicates that momentum has moderated following previously stronger relative performance. A sustained recovery towards the horizontal axis would suggest stabilisation, while a further decline could eventually result in a transition into Lagging.
Energy (XLE) and Information Technology (XLK) remain in the Lagging quadrant, where both relative strength and momentum are negative. Energy is the most deeply positioned sector on the chart, reflecting exceptionally weak relative momentum. Its historical trail shows a substantial deterioration from earlier readings, although the latest trajectory suggests some upward movement from the extreme low. Nevertheless, the sector remains firmly within Lagging and has yet to cross either quadrant boundary.
Information Technology also remains in Lagging, with its latest endpoint positioned deeply within negative relative strength territory and below the horizontal reference line. Its trajectory indicates that the sector has experienced persistent relative weakness, although its negative momentum reading is considerably less extreme than Energy's. A sustained upward and rightward movement would be required before either sector could demonstrate a meaningful recovery in relative leadership.
The distinction between improving momentum and positive relative strength remains important. Both sectors must first move above the horizontal boundary to enter Improving, followed by a move to the right of the vertical axis to establish positive relative strength and enter Leading. Until these transitions occur, their current positioning indicates continued relative underperformance.
Bottom Line
The US sector momentum configuration on 13 November 2026 shows a broader leadership group, with six sectors occupying Leading: Industrials, Financials, Consumer Discretionary, Real Estate, Health Care and Utilities. Utilities' transition into Leading represents a notable improvement from its previous Weakening position, while Communication Services remains the only sector in Improving, supported by a strong upward trajectory in relative momentum. Materials and Consumer Staples continue to occupy Weakening, indicating deteriorating momentum despite positive relative strength. Energy and Information Technology remain in Lagging, with Energy displaying the weakest relative momentum position despite an initial upward turn in its trail. Overall, the chart indicates that leadership is broadening across the US Equity market, although performance remains uneven. Investors monitoring relative rotation should watch whether Communication Services can progress into Leading, whether Utilities can sustain its improved position, and whether Energy and Technology can recover towards the zero boundaries.


 Nov 16, 2026





 Please wait processing your request...