
Key Highlights
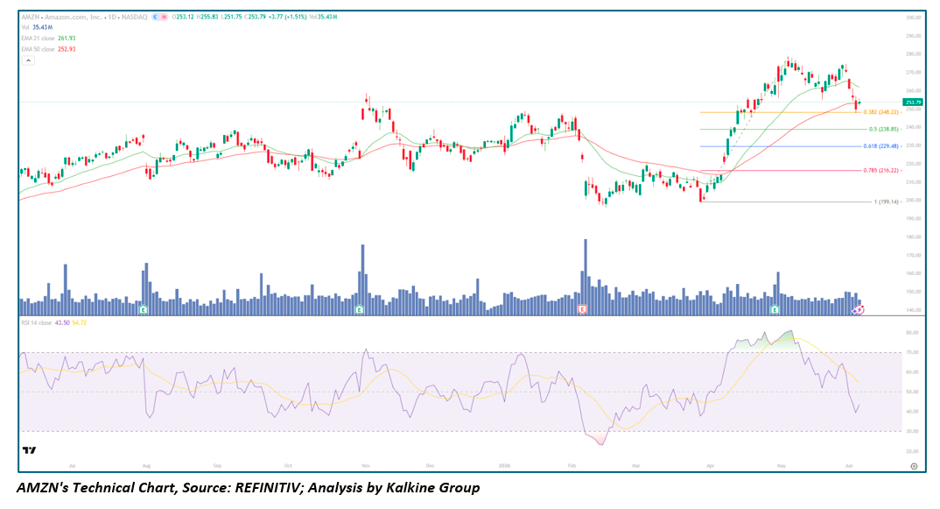
Amazon closed at $253.79, gaining $3.77 (+1.51%) in a constructive session reflecting continued buying interest near recent consolidation lows. Price traded between $251.75 and $255.83 intraday, reflecting orderly price action consistent with a stock finding support after a meaningful pullback from highs. The stock trades above its 50-day EMA at $252.93, though the 21-day EMA at $261.93 now sits above current price — a near-term caution flag worth monitoring. RSI-14 closed at 43.50 with the signal line at 54.72, indicating momentum has cooled materially from recent overbought extremes and is approaching oversold territory. Volume at 35.43M remains healthy, consistent with institutional participation rather than panic selling. Amazon has rallied from February 2026 lows near $199 to recent April highs near $280 — an advance of approximately 40% — before the current controlled pullback to the $253 zone.
Trend Structure: From February Shock Lows to a Powerful Multi-Month Recovery
Phase 1 — Bottoming and Early Recovery (Mid-2025 to January 2026)
Amazon entered the visible chart period in a broadly sideways-to-recovering phase following a period of range-bound price action in the $175–$230 zone. Price oscillated without strong directional conviction through much of mid-2025, with the 21-day and 50-day EMAs running in close proximity and offering limited trend confirmation. RSI spent extended periods in the neutral 40–60 zone, reflecting the absence of sustained directional momentum in either direction. Volume spikes around quarterly Earnings events provided brief directional impulses but were followed by consolidation rather than sustained trend continuation. Higher lows began forming toward the end of this phase, providing the first structural hint that buyers were gradually gaining the upper hand and that a more powerful directional move was building beneath the surface.
Phase 2 — Sharp Decline and Capitulation (February 2026)
The February 2026 period delivered Amazon's most dramatic and damaging price action of the visible chart — a sharp decline that drove the stock to lows near $199, representing the largest single drawdown visible on the chart. RSI plunged toward the high-20s during the most aggressive phase of the decline, reaching deeply oversold territory and reflecting significant short-term momentum damage. Volume spiked dramatically during this period, consistent with forced institutional Liquidation and panic selling from shorter-term holders. The $199 level — the 1.0 Fibonacci Retracement level visible on the current chart — marked the ultimate low of the move and the point at which buyers began to overwhelm sellers in a meaningful and sustained way. The speed and severity of the decline, combined with the depth of the RSI reading, created the conditions for an equally powerful recovery phase that would follow.
Phase 3 — Explosive Recovery and Breakout to Highs (February to April 2026)
From the $199 capitulation low, Amazon staged one of the most powerful recoveries visible across the chart — advancing approximately 40% in roughly two months to reach highs near $280 by April. The recovery was characterised by relentless higher highs and higher lows, with EMA-21 crossing back above EMA-50 in a fresh golden cross that confirmed the momentum shift had become structural rather than merely reactive. RSI surged from deeply oversold readings near the high-20s back through the neutral 50 level and into overbought territory above 70, confirming the full restoration of bullish momentum. Volume remained constructively elevated during upside sessions and declined appropriately during minor pullbacks — the textbook accumulation fingerprint of institutional buying programmes being deployed at scale. The move from $199 to $280 was among the cleanest and most technically consistent recovery trends visible in the large-cap technology space during this period.
Phase 4 — Post-Breakout Pullback and Current Consolidation (May to June 2026)
Following the April highs near $280, Amazon entered a controlled pullback phase that has retraced the stock back to the current $253 zone. This pullback has been orderly rather than panicked — volume has been moderate, price has not collapsed, and the broader EMA structure remains supportive. The current price level sits almost precisely at the 0.382 Fibonacci retracement of the full February-to-April advance, which historically represents the shallowest and most bullish retracement zone. RSI cooling from overbought above 70 back to the current 43.50 reading is entirely consistent with healthy post-rally digestion rather than trend Reversal. The key technical question at this juncture is whether the $248–$253 Fibonacci support zone holds and becomes the launchpad for the next advance, or whether sellers push the stock toward deeper retracement levels.
Moving Averages: Near-Term Caution Within a Broadly Bullish Medium-Term Structure
EMA-21 ($261.93)
The 21-day EMA now sits above current price at $261.93 — a near-term bearish configuration that reflects the pullback from April highs. Price trading below the EMA-21 is not inherently alarming in the context of the broader recovery, but it does indicate that short-term momentum has shifted to a cautious footing. A reclaim of the EMA-21 on a daily closing basis would represent the single most important near-term technical catalyst for restoring full short-term bullish conviction. Until that reclaim occurs, the near-term path of least resistance remains sideways to modestly lower.
EMA-50 ($252.93)
The 50-day EMA at $252.93 is the most critical level on the current chart. Amazon closed just $0.86 above this level, meaning the stock is effectively resting on its medium-term dynamic support. The EMA-50 has been rising consistently since the February lows, reflecting the strength and durability of the recovery trend. A daily close and sustained hold above $252.93 preserves the full medium-term bullish thesis. A decisive break below this level on elevated volume would raise meaningful caution and open the door to a test of deeper Fibonacci support levels in the $238–$229 zone. The EMA-50 interaction over the coming sessions is the most important near-term technical watch for Amazon.
Fibonacci Retracement Analysis: A Roadmap for the Pullback
The Fibonacci retracement levels plotted on the chart are drawn from the February 2026 swing low at $199.14 to the April 2026 swing high near $280, providing a clear framework for assessing the depth and health of the current pullback.
The 0.382 level at $248.22 represents the shallowest retracement and the first meaningful support zone. A hold at or above this level would confirm that bulls remain firmly in control and that the broader uptrend is intact. Current price at $253.79 is testing proximity to this zone, making it the most immediately relevant level on the chart.
The 0.5 level at $238.85 is the midpoint of the entire February-to-April advance. A pullback to this level would still be considered technically healthy in the context of a strong prior advance, but would suggest sellers have more conviction than the shallow retracement scenario implies.
The 0.618 level at $229.48 is the golden ratio retracement and widely regarded as the deepest level consistent with a healthy bull trend correction. Institutional buyers frequently accumulate aggressively at this level in trending stocks. A touch of $229 followed by a recovery would actually represent one of the highest-conviction buying opportunities visible on the chart.
The 0.785 level at $216.22 would represent a deep and concerning retracement, suggesting structural damage to the recovery trend and raising the probability of a return toward the February lows.
The 1.0 level at $199.14 is the February swing low and the ultimate invalidation point for the entire bullish recovery thesis. A break below this level would represent a complete technical breakdown and fundamentally alter the medium-term outlook.
Momentum Analysis: RSI Approaching Levels That Have Historically Preceded Recoveries
RSI-14 at 43.50 with the signal line at 54.72 reflects a meaningful and rapid cooling of momentum from the overbought readings seen at the April highs. The RSI line sitting below its signal line confirms that the near-term momentum deterioration has been genuine and not merely a brief pause. However, at 43.50, the RSI is approaching the 40 level that has historically marked the lower boundary of momentum resets within Amazon's broader uptrend phases. RSI readings in the 38–45 zone during prior pullbacks throughout this chart have consistently preceded recoveries back toward the 55–70 range. The current reading does not yet confirm a momentum low is in place, but the proximity to historically supportive RSI territory makes this a level worth monitoring closely for a potential bullish divergence or momentum turn.
Key Technical Levels
Support Levels: $252–$253 — EMA-50 and immediate dynamic support, the most critical near-term level. $248 — 0.382 Fibonacci retracement, first major structural support. $238–$239 — 0.5 Fibonacci retracement and secondary support zone. $229–$230 — 0.618 golden ratio retracement, high-conviction institutional support. $216 — 0.785 Fibonacci retracement, deep support and last line before trend invalidation. $199 — February swing low and full trend invalidation level.
Resistance Levels: $261–$262 — EMA-21, immediate resistance and near-term recovery target. $270–$275 — prior consolidation zone from the April advance. $280 — April swing high and major resistance. $290–$300 — longer-term extension targets if the $280 breakout is sustained.
Scenario Analysis
Bullish Continuation (Primary Case)
If Amazon holds above the EMA-50 at $252.93 and the 0.382 Fibonacci level at $248 through the current consolidation phase, a recovery back toward the EMA-21 at $261 becomes the immediate technical target, followed by a retest of the April highs near $280. RSI recovering from the low-40s back above 50 would confirm that momentum has stabilised and that the pullback low is in place. AWS growth acceleration, expanding AI infrastructure Demand, and Advertising Revenue strength continue to provide fundamental support for the technical recovery thesis.
Sideways Consolidation (Constructive Outcome)
Price may continue consolidating between $248 and $262 for several sessions, allowing the EMA-21 to descend toward current price and the EMA-50 to rise beneath it — compressing the Moving Average spread and building a tighter base for the next directional move. RSI stabilising in the 40–50 zone and basing before turning higher would be the momentum confirmation signal to watch. A tight consolidation in this zone would ultimately produce a cleaner and more powerful setup for a renewed assault on the $280 highs.
Bearish Breakdown (Risk Case)
A daily close below the EMA-50 at $252.93 on elevated volume would raise near-term caution and open the path toward the 0.5 Fibonacci level at $238 and potentially the 0.618 at $229. RSI breaking decisively below 40 would confirm momentum deterioration is deepening beyond a healthy reset. However, given the strength of the February-to-April recovery, the quality of Amazon's fundamental earnings profile, and the rising slope of the EMA-50, this scenario represents the lower-probability outcome in the current technical environment.
Conclusion: Amazon Holds Key Support at a Critical Fibonacci and Moving Average Confluence
Amazon has delivered a technically impressive 40% recovery from its February 2026 lows, and the current pullback to the $253 zone represents a natural and healthy digestion of those gains. The stock is now testing a significant confluence of support — the EMA-50 at $252.93 and the 0.382 Fibonacci retracement at $248.22 — making the current zone one of the most technically important price areas on the chart. The RSI approaching historically supportive levels near 40, combined with orderly rather than panicked selling, reinforces the view that this is consolidation within an ongoing uptrend rather than the beginning of a structural reversal.
The framework moving forward is clear. Above EMA-50 at $252.93 and the 0.382 Fibonacci at $248, the bullish recovery thesis remains fully intact and a retest of $280 is the primary scenario. A reclaim of EMA-21 at $261.93 would restore full short-term bullish momentum and confirm the pullback low is in place. Below EMA-50 on a closing basis, caution increases and the 0.5 and 0.618 Fibonacci zones at $238 and $229 become the next areas of focus. For momentum investors and technology sector allocators, Amazon currently presents a technically well-defined risk-reward setup at a major support confluence, backed by one of the most powerful fundamental growth engines in the global economy.


 Please wait processing your request...