 CA
 NZ
 UK
 AU
 IND

 US


…
Hysan Development Company Limited is a leading property investment, management, and development company with a core portfolio of high-quality office, retail and residential space in Hong Kong. With roots in the city that go back more than 100 years, Hysan has focused on building the community, mixing the traditional and the new, applying technology and practicing sustainability. It has transformed the Lee Gardens area into a modern smart community, with a unique Hong Kong character, making it an attractive destination for leading multinational corporations, international visitors and residents. The Company has been growing its core portfolio through upgrades and expansion. It has also invested in strategic growth pillars which target opportunities brought about by the New Economy, with the aim of reinforcing Hysan's business by geography and by sector. Among its strategic pillars are Lee Gardens Shanghai and residential property development projects. Hysan Development Company Limited was incorporated in 1923 in Hong Kong.
Source: TradingView
The charts and visual representations are sourced from TradingView through embedded widgets. For any issues with chart display, please visit the TradingView website
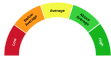
A unique technical analysis driven score developed by Kalkine showing momentum in stock prices based on select technical indicators identified.
Hysan Development is a Hong Kong-based property investment, development and management company focused on office, retail and residential assets concentrated in Causeway Bay. Long-term growth may be supported by recurring rental income from prime retail and office space, periodic asset upgrading and redevelopment, and an eventual recovery in local consumption and tourism, which could support rental demand; investors may find the company attractive for its concentrated, income-producing urban portfolio.
Key risks include concentrated exposure to Hong Kong’s retail and office markets, cyclical property values and rent sensitivity to interest rates, tourist flows and regulatory or macroeconomic shifts that investors should monitor.

Note: The summary and risk score provided above is created by AI and should not be construed as a recommendation of Kalkine.


| Breakdown | 2025-12-31 | 2024-12-31 | 2023-12-31 | 2022-12-31 | 2021-12-31 |
|---|---|---|---|---|---|
| Type | yearly | yearly | yearly | yearly | yearly |
| Date | 2025-12-31 | 2024-12-31 | 2023-12-31 | 2022-12-31 | 2021-12-31 |
| Income before tax | 590.99M | 567.00M | -731.00M | -607.00M | 2261.00M |
| Minority interest | 19.00M | -236.00M | 154.00M | -208.00M | -520.00M |
| Net income | 838.57M | 35.00M | -430.00M | -1157.00M | 1383.00M |
| Selling general administrative | 309.00M | 308.00M | 307.00M | 332.00M | 274.00M |
| Gross profit | 2882.07M | 2763.00M | 2589.00M | 2893.00M | 3109.00M |
| Reconciled depreciation | 42.00M | 36.00M | 33.00M | 32.00M | 29.00M |
| Ebit | 1139.05M | 984.00M | -301.00M | -233.00M | 2547.00M |
| Ebitda | 1180.98M | 1020.00M | -268.00M | -201.00M | 2576.00M |
| Depreciation and amortization | 41.93M | 36.00M | 33.00M | 32.00M | 29.00M |
| Operating income | 2617.53M | 2455.00M | 2282.00M | -233.00M | 2547.00M |
| Other operating expenses | 991.31M | 954.00M | 928.00M | 899.00M | 773.00M |
| Interest expense | 548.06M | 417.00M | 478.00M | 408.00M | 348.00M |
| Tax provision | 296.00M | 296.00M | 295.00M | 342.00M | 358.00M |
| Interest income | - | - | - | - | 92.00M |
| Net interest income | -496.00M | -481.00M | -478.00M | -450.00M | -301.00M |
| Income tax expense | 295.50M | 296.00M | 295.00M | 342.00M | 358.00M |
| Total revenue | 3608.83M | 3409.00M | 3210.00M | 3460.00M | 3608.00M |
| Total operating expenses | 264.55M | 308.00M | 307.00M | 332.00M | 274.00M |
| Cost of revenue | 726.76M | 646.00M | 621.00M | 567.00M | 499.00M |
| Total other income expense net | -2026.54M | -1888.00M | -3013.00M | -374.00M | -286.00M |
| Net income from continuing ops | 296.00M | 271.00M | -1026.00M | -949.00M | 1903.00M |
| Net income applicable to common shares | - | - | - | -1157.00M | 1383.00M |
| Breakdown | 2025-12-31 | 2024-12-31 | 2023-12-31 | 2022-12-31 | 2021-12-31 |
|---|---|---|---|---|---|
| Type | yearly | yearly | yearly | yearly | yearly |
| Date | 2025-12-31 | 2024-12-31 | 2023-12-31 | 2022-12-31 | 2021-12-31 |
| Total assets | 115410.73M | 114089.00M | 114526.00M | 119165.00M | 117373.00M |
| Other current assets | 944.87M | 3.00M | -954.00M | 5461.00M | 1866.00M |
| Total liab | 48607.25M | 36660.00M | 34835.00M | 35754.00M | 29488.00M |
| Total stockholder equity | 65449.61M | 75430.00M | 77406.00M | 80424.00M | 84527.00M |
| Other current liab | -650.00M | 1389.00M | 1359.00M | 1364.00M | 1213.00M |
| Common stock | 7722.25M | 7723.00M | 7723.00M | 7723.00M | 7723.00M |
| Capital stock | 7723.00M | 7723.00M | 7723.00M | 7723.00M | 7723.00M |
| Retained earnings | 57935.00M | 58726.00M | 59747.00M | 62097.00M | 64969.00M |
| Other liab | - | - | - | - | 1716.00M |
| Other assets | - | - | -1669.00M | - | 3199.00M |
| Cash | 3830.63M | 1564.00M | 2583.00M | 2560.00M | 6538.00M |
| Total current liabilities | 1902.81M | 4862.00M | 1807.00M | 4903.00M | 1937.00M |
| Current deferred revenue | - | - | 1008.00M | - | - |
| Net debt | 34093.67M | 24950.00M | 22981.00M | 24717.00M | 12119.00M |
| Short term debt | 1902.81M | 2872.00M | 158.00M | 3244.00M | 531.00M |
| Short long term debt | 1903.00M | 2872.00M | 158.00M | 3244.00M | 531.00M |
| Short long term debt total | 37924.30M | 26514.00M | 25564.00M | 27277.00M | 18657.00M |
| Other stockholder equity | 9202.00M | 8981.00M | 10671.00M | 10604.00M | 76804.00M |
| Property plant equipment | - | - | - | 97410.00M | 95579.00M |
| Total current assets | 5536.46M | 2907.00M | 4252.00M | 8348.00M | 9501.00M |
| Net tangible assets | - | - | - | 80424.00M | 84527.00M |
| Short term investments | 419.96M | 965.00M | 1365.00M | 5226.00M | 2037.00M |
| Net receivables | 341.00M | 375.00M | 1258.00M | 562.00M | 926.00M |
| Long term debt | 26621.00M | 23642.00M | 25406.00M | 24033.00M | 18126.00M |
| Accounts payable | 650.00M | 534.00M | 289.00M | 295.00M | 193.00M |
| Accumulated other comprehensive income | -201.98M | -58.70M | -735.00M | - | - |
| Non currrent assets other | 1610.84M | 103293.00M | 102361.00M | 106332.00M | 100253.00M |
| Non current assets total | 109874.27M | 111182.00M | 110274.00M | 110817.00M | 107872.00M |
| Breakdown | 2025-12-31 | 2024-12-31 | 2023-12-31 | 2022-12-31 | 2021-12-31 |
|---|---|---|---|---|---|
| Type | yearly | yearly | yearly | yearly | yearly |
| Date | 2025-12-31 | 2024-12-31 | 2023-12-31 | 2022-12-31 | 2021-12-31 |
| Investments | 961.00M | -1286.00M | -2200.00M | -8616.00M | 7007.00M |
| Change to liabilities | - | - | - | 0.00M | -97.00M |
| Total cashflows from investing activities | 771.00M | -1286.00M | 2138.00M | - | -15047.00M |
| Net borrowings | 1960.00M | 990.00M | -1736.00M | - | 7507.00M |
| Total cash from financing activities | -795.00M | -2088.00M | -4324.00M | 2172.00M | 4720.00M |
| Change to operating activities | - | - | - | - | -56.00M |
| Net income | 592.00M | 567.00M | -731.00M | -607.00M | 2261.00M |
| Change in cash | 2267.00M | -1019.00M | 23.00M | -3978.00M | -7851.00M |
| Begin period cash flow | 1564.00M | 2583.00M | 2560.00M | 6538.00M | 14389.00M |
| End period cash flow | 3831.00M | 1564.00M | 2583.00M | 2560.00M | 6538.00M |
| Total cash from operating activities | 2288.00M | 2356.00M | 2207.00M | 2395.00M | 2476.00M |
| Issuance of capital stock | - | - | - | 0.00M | 1.00M |
| Depreciation | 42.00M | 36.00M | 33.00M | 32.00M | 29.00M |
| Other cashflows from investing activities | -174.00M | -1955.00M | -1755.00M | - | 280.00M |
| Dividends paid | 1109.00M | 1109.00M | 1479.00M | -1486.00M | -1497.00M |
| Change to account receivables | 50.00M | -199.00M | 102.00M | - | 126.00M |
| Sale purchase of stock | -2.00M | -728.00M | -1.00M | -162.00M | -146.00M |
| Other cashflows from financing activities | -1644.00M | -1241.00M | -1108.00M | 4431.00M | 7162.00M |
| Change to netincome | - | - | - | - | 213.00M |
| Capital expenditures | 16.00M | 35.00M | 18.00M | 19.00M | 72.00M |
| Change in working capital | 11.00M | -190.00M | 113.00M | -9.00M | -27.00M |
| Stock based compensation | 4.00M | 5.00M | 3.00M | 7.00M | 5.00M |
| Other non cash items | 1639.00M | 1938.00M | 2789.00M | 2972.00M | 208.00M |
| Free cash flow | 2272.00M | 2321.00M | 2189.00M | 2376.00M | 2404.00M |
Sector: Real Estate Industry: Real Estate Services
|
Stock Name
|
Change
(USD) |
Price
(USD) |
Trailing
PE (x) |
Forward
PE (x) |
Price Sales
TTM (x) |
Price to Book Value (x)
|
Enterprise Value
to Revenue (x) |
Enterprise Value
to EBITDA (x) |
|---|---|---|---|---|---|---|---|---|
| HYSNY Hysan Development Co Ltd |
-0.23 5.56% |
3.91 | 48.50 | 9.28 | 0.72 | 0.21 | 11.35 | 35.16 |
| CBRE CBRE Group Inc Class A |
-0.06 0.05% |
130.65 | 38.92 | 21.37 | 1.09 | 4.95 | 1.28 | 25.73 |
| BEKE Ke Holdings Inc |
0.05 0.27% |
18.46 | 42.90 | 16.92 | 0.33 | 2.33 | 1.66 | 24.07 |
| VNNVF Vonovia SE |
- -% |
18.54 | - | 13.44 | 3.96 | 0.83 | 4.07 | -3.05 |
| VTAGY Vantage Towers AG |
- -% |
21.42 | 42.00 | 37.59 | 28.32 | 3.61 | 21.19 | 24.26 |
Hysan Development Company Limited is a leading property investment, management, and development company with a core portfolio of high-quality office, retail and residential space in Hong Kong. With roots in the city that go back more than 100 years, Hysan has focused on building the community, mixing the traditional and the new, applying technology and practicing sustainability. It has transformed the Lee Gardens area into a modern smart community, with a unique Hong Kong character, making it an attractive destination for leading multinational corporations, international visitors and residents. The Company has been growing its core portfolio through upgrades and expansion. It has also invested in strategic growth pillars which target opportunities brought about by the New Economy, with the aim of reinforcing Hysan's business by geography and by sector. Among its strategic pillars are Lee Gardens Shanghai and residential property development projects. Hysan Development Company Limited was incorporated in 1923 in Hong Kong.
| Name | Title | Year Born |
|---|---|---|
| Ms. Yun-Lien Lee BA | Exec. Chairman | 1954 |
| Mr. Kon Wai Lui M.B.A., MBA, MCIOB | Exec. Director & COO | 1965 |
| Mr. Shu Yan Hao ACA, ACCA, BBA (Hons), CPA | CFO & Company Sec. | 1966 |
| Ms. Catherine Ng | Head of Corp. Communications | NA |
| Ms. Tze Pon Lam | Director of Marketing & Customer Experience | 1972 |
| Antie Leung | Head of HR | NA |
| Mark Tung | Assistant Gen. Mang. of Corp. Communications | NA |
| Mrs. Wah Ling Yu Wong | Sr. Advisor | 1949 |
| Mr. Chun Wan Lui | Sr. Advisor of Urban Design & Architectural Services | 1944 |
| Mr. Hoo Tim Lee | Adviser to the Board | NA |
Disclaimer - (*)This information, including any data, is sourced from Unicorn Data Services SAS, trading as EOD Historical Data (“EODHD”) on an ‘as is’ basis, using their API. We cannot guarantee the completeness or validity of the information and data provided on this page, as well as via the API. In some cases, the data may include analyst ratings or recommendations sourced through the EODHD API, which are intended solely for general information purposes.
This information does not consider your personal objectives, financial situation, or needs. Kalkine is not liable for any errors or omissions in the information provided or for any actions taken in reliance on it. You should seek advice from a financial adviser, stockbroker or other professional adviser (including taxation and legal advice) as necessary before acting on this information.

Download a free report with stock ideas and industry insights for general information.
Download Free Report Now →


Basic Materials
 -1.68%
Communication Services
 +0.09%

Consumer Cyclical
+0.65%

Consumer Defensive
+0.20%

Energy
-1.16%

Financial Services
-0.27%
Financials
-0.67%

Healthcare
+0.06%

Industrials
+0.05%

Real Estate
+0.22%

Technology
+0.50%

Utilities
+0.39%
Note: Daily price change (%) by sector excluding stocks with +/-90% daily price change. Companies above $500 million market capitalization are considered.
 Portfolio
 Watchlist


 Please wait processing your request...