 CA
 NZ
 UK
 AU
 IND

 US


…
HUB Cyber Security Ltd. provides cyber security solutions in Israel, the Americas, the Asia Pacific, and Europe. The company operates in two segments, Product and Technology and Professional Services. It develops and markets integrated cybersecurity hardware/software solutions, including data and cybersecurity, system security, reliability solutions, and related services, such as consulting, planning, training, integrating, and ongoing servicing of cybersecurity, risk management, system quality, reliability and security projects, and fully managed corporate cybersecurity services. The company also provides ALD Software, a software suite for the safety and reliability analysis software for civil and military aviation, communication, space, and electronics organizations; RAM Commander, a reliability and safety software that covers engineering tasks related to reliability of electronic, electro-mechanical, and mechanical systems; Safety Commander, a software that provides fail-safe design for any system of system safety assessment across multiple industries; and FavoWeb FRACAS, an ALD web-based and user-configurable failure reporting, analysis, and corrective action system. In addition, the company offers ALD College, offers various courses in the areas of quality and reliability for private participants and institutions; outsourcing services; and secured data fabric and confidential computing. Further, it provides tech solutions and consulting, such as software development and testing, cybersecurity, information systems, consulting, and training for large enterprises, militaries, and government agencies. HUB Cyber Security Ltd. was founded in 1984 and is headquartered in Or Yehuda, Israel.
Source: TradingView
The charts and visual representations are sourced from TradingView through embedded widgets. For any issues with chart display, please visit the TradingView website
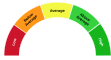
A unique technical analysis driven score developed by Kalkine showing momentum in stock prices based on select technical indicators identified.
Hub Cyber Security Ltd is a NASDAQ-listed company described in public records as operating in the cybersecurity sector to protect digital assets. Long-term growth drivers include rising cyber threats, broader cloud adoption, and tighter regulatory requirements, which may support demand for its offerings and position it as exposure to cybersecurity market growth.
Principal risks are limited public disclosures and short operating history increasing execution and financing risk, intense competition from larger vendors, and potential illiquidity of its shares.

Note: The summary and risk score provided above is created by AI and should not be construed as a recommendation of Kalkine.


| Breakdown | 2025-12-31 | 2024-12-31 | 2023-12-31 | 2022-12-31 | 2021-12-31 |
|---|---|---|---|---|---|
| Type | yearly | yearly | yearly | yearly | yearly |
| Date | 2025-12-31 | 2024-12-31 | 2023-12-31 | 2022-12-31 | 2021-12-31 |
| Income before tax | -117.31M | -36.59M | -81.34M | -80.74M | -42.47M |
| Minority interest | 0.00M | -0.73M | -0.81M | -1.59M | 1.25M |
| Net income | -119.79M | -39.76M | -81.59M | -81.59M | -42.71M |
| Selling general administrative | 30.51M | 23.08M | 47.53M | 49.92M | 10.65M |
| Selling and marketing expenses | - | 1.70M | 1.01M | - | 0.12M |
| Gross profit | 5.29M | 5.05M | 4.09M | 6.45M | 16.16M |
| Reconciled depreciation | 1.90M | 2.38M | 7.64M | 7.79M | 5.16M |
| Ebit | - | -24.68M | -79.51M | -79.51M | -42.07M |
| Ebitda | - | -22.30M | -71.72M | -62.91M | -36.91M |
| Depreciation and amortization | - | 2.38M | 7.79M | - | 5.16M |
| Operating income | -30.82M | -26.22M | -80.43M | -64.89M | -41.47M |
| Other operating expenses | - | 55.78M | 130.43M | - | 144.75M |
| Interest expense | 20.97M | 12.20M | 1.70M | 3.40M | 0.33M |
| Tax provision | 0.74M | 0.56M | 0.17M | -0.74M | 1.49M |
| Interest income | 0.33M | 0.55M | 0.21M | 0.45M | 0.01M |
| Net interest income | -20.81M | -11.65M | -6.73M | -2.95M | -0.66M |
| Income tax expense | - | 0.56M | -0.78M | -0.74M | 1.49M |
| Total revenue | 31.66M | 29.56M | 50.00M | 79.74M | 103.31M |
| Total operating expenses | 62.49M | 31.27M | 84.52M | 144.63M | 57.61M |
| Cost of revenue | 26.37M | 24.52M | 45.91M | 73.30M | 87.14M |
| Total other income expense net | -65.67M | -10.37M | -0.92M | -14.60M | -1.00M |
| Net income from continuing ops | -118.05M | -37.15M | -84.61M | -80.00M | -43.95M |
| Net income applicable to common shares | - | - | - | -81.59M | -13.23M |
| Breakdown | 2025-12-31 | 2024-12-31 | 2023-12-31 | 2022-12-31 | 2021-12-31 |
|---|---|---|---|---|---|
| Type | yearly | yearly | yearly | yearly | yearly |
| Date | 2025-12-31 | 2024-12-31 | 2023-12-31 | 2022-12-31 | 2021-12-31 |
| Total assets | 21.50M | 27.42M | 74.79M | 74.79M | 374.07M |
| Intangible assets | 0.83M | 4.34M | 16.20M | 16.20M | 70.34M |
| Other current assets | 2.80M | 7.42M | 2.04M | 1.57M | 1.22M |
| Total liab | 137.17M | 108.23M | 65.98M | 65.98M | 169.50M |
| Total stockholder equity | -115.64M | -80.79M | 6.41M | 6.41M | 201.31M |
| Other current liab | 8.11M | 57.65M | 3.84M | 29.16M | 30.05M |
| Common stock | - | 117.25M | 81.62M | 81.62M | 108.98M |
| Capital stock | 193.02M | 117.25M | - | 81.62M | 108.98M |
| Retained earnings | -346.03M | -226.25M | -99.04M | -99.04M | -57.39M |
| Other liab | - | - | - | 3.15M | 6.68M |
| Good will | 2.14M | 1.87M | 13.70M | 13.70M | 95.95M |
| Other assets | - | - | - | 3.87M | 7.67M |
| Cash | 1.76M | 3.08M | 3.99M | 3.99M | 43.46M |
| Total current liabilities | 135.63M | 106.07M | 57.84M | 57.84M | 118.05M |
| Current deferred revenue | - | 0.95M | 25.32M | - | - |
| Net debt | 71.60M | 37.40M | 15.90M | 9.44M | 28.58M |
| Short term debt | - | 39.27M | 14.90M | - | 41.37M |
| Short long term debt | 73.36M | 38.30M | - | 13.43M | 35.08M |
| Short long term debt total | - | 40.48M | 19.90M | - | 72.04M |
| Other stockholder equity | - | 9.69M | 9.14M | 25.07M | 149.72M |
| Property plant equipment | - | - | - | 7.82M | 9.38M |
| Total current assets | 16.10M | 18.40M | 33.20M | 33.20M | 154.76M |
| Net tangible assets | - | - | - | -23.49M | 11.32M |
| Net receivables | 10.26M | 7.90M | 25.27M | 25.73M | 79.78M |
| Long term debt | - | - | - | - | 11.81M |
| Inventory | - | - | 1.90M | 1.90M | 5.72M |
| Accounts payable | 9.82M | 8.20M | 13.77M | 13.77M | 46.63M |
| Accumulated other comprehensive income | - | 18.52M | 14.70M | - | - |
| Non currrent assets other | 0.22M | 0.16M | 3.87M | 3.00M | 10.92M |
| Non current assets total | 5.39M | 9.01M | 41.59M | 41.59M | 219.31M |
| Capital lease obligations | 1.86M | 2.19M | - | 6.47M | 25.14M |
| Breakdown | 2025-12-31 | 2024-12-31 | 2023-12-31 | 2022-12-31 | 2021-12-31 |
|---|---|---|---|---|---|
| Type | yearly | yearly | yearly | yearly | yearly |
| Date | 2025-12-31 | 2024-12-31 | 2023-12-31 | 2022-12-31 | 2021-12-31 |
| Investments | 0.00M | -0.45M | - | -6.55M | -49.62M |
| Change to liabilities | - | - | - | 0.54M | 8.69M |
| Total cashflows from investing activities | - | -0.45M | - | -6.55M | -15.98M |
| Net borrowings | 25.34M | 18.80M | - | -1.50M | -0.84M |
| Total cash from financing activities | 25.34M | 17.18M | 20.66M | 20.66M | 107.53M |
| Change to operating activities | - | - | - | 17.68M | -0.58M |
| Net income | -119.79M | -39.03M | -80.00M | -81.59M | -43.95M |
| Change in cash | -1.32M | -0.44M | -9.98M | -9.98M | 39.40M |
| Begin period cash flow | 3.08M | 3.52M | 13.97M | 13.97M | 4.06M |
| End period cash flow | 1.76M | 3.08M | 3.99M | 3.99M | 43.46M |
| Total cash from operating activities | -31.40M | -17.11M | -23.43M | -23.43M | -18.50M |
| Issuance of capital stock | 0.00M | 0.00M | - | 21.09M | 112.39M |
| Depreciation | 1.90M | 2.38M | 7.79M | 7.79M | 5.16M |
| Other cashflows from investing activities | - | -0.37M | - | -0.52M | -3.51M |
| Dividends paid | - | - | - | - | 1.38M |
| Change to inventory | 0.00M | 1.81M | -0.29M | -0.29M | -3.74M |
| Change to account receivables | 0.69M | 1.89M | -1.45M | -1.45M | -7.01M |
| Sale purchase of stock | - | - | - | 0.00M | -3.95M |
| Other cashflows from financing activities | - | -1.62M | 2.85M | -0.02M | -0.73M |
| Change to netincome | - | - | - | 32.30M | 5.47M |
| Capital expenditures | 0.03M | 0.08M | 0.62M | 6.03M | 1.46M |
| Change in working capital | -5.34M | 8.81M | 16.48M | 16.48M | 1.24M |
| Stock based compensation | 3.19M | 2.07M | 10.52M | 10.52M | 19.05M |
| Other non cash items | 50.24M | 8.70M | 22.84M | 0.90M | -0.00M |
| Free cash flow | -31.43M | -17.19M | -24.06M | -24.06M | -19.97M |
Sector: Technology Industry: Software - Infrastructure
|
Stock Name
|
Change
(USD) |
Price
(USD) |
Trailing
PE (x) |
Forward
PE (x) |
Price Sales
TTM (x) |
Price to Book Value (x)
|
Enterprise Value
to Revenue (x) |
Enterprise Value
to EBITDA (x) |
|---|---|---|---|---|---|---|---|---|
| HUBC Hub Cyber Security Ltd. Ordinary Shares |
-0.01 9.38% |
0.13 | - | - | 0.36 | 3.71 | 2.68 | -2.76 |
| MSFT Microsoft Corporation |
-0.32 0.06% |
531.01 | 37.32 | 29.94 | 13.03 | 12.45 | 13.06 | 24.59 |
| ORCL Oracle Corporation |
14.01 10.73% |
144.54 | 21.96 | 17.89 | 5.91 | 7.08 | 7.82 | 14.89 |
| CRWD Crowdstrike Holdings Inc |
-1.36 0.51% |
266.66 | 4849.80 | 188.68 | 46.01 | 47.24 | 43.89 | 559.34 |
| FTNT Fortinet Inc |
-10.92 5.90% |
174.08 | 60.27 | 43.86 | 16.80 | 80.50 | 16.11 | 43.33 |
HUB Cyber Security Ltd. provides cyber security solutions in Israel, the Americas, the Asia Pacific, and Europe. The company operates in two segments, Product and Technology and Professional Services. It develops and markets integrated cybersecurity hardware/software solutions, including data and cybersecurity, system security, reliability solutions, and related services, such as consulting, planning, training, integrating, and ongoing servicing of cybersecurity, risk management, system quality, reliability and security projects, and fully managed corporate cybersecurity services. The company also provides ALD Software, a software suite for the safety and reliability analysis software for civil and military aviation, communication, space, and electronics organizations; RAM Commander, a reliability and safety software that covers engineering tasks related to reliability of electronic, electro-mechanical, and mechanical systems; Safety Commander, a software that provides fail-safe design for any system of system safety assessment across multiple industries; and FavoWeb FRACAS, an ALD web-based and user-configurable failure reporting, analysis, and corrective action system. In addition, the company offers ALD College, offers various courses in the areas of quality and reliability for private participants and institutions; outsourcing services; and secured data fabric and confidential computing. Further, it provides tech solutions and consulting, such as software development and testing, cybersecurity, information systems, consulting, and training for large enterprises, militaries, and government agencies. HUB Cyber Security Ltd. was founded in 1984 and is headquartered in Or Yehuda, Israel.
| Name | Title | Year Born |
|---|---|---|
| Ms. Osher Partok Rheinisch | Chief Legal Officer | 1973 |
| Mr. Noah Hershcoviz | CEO & Director | 1983 |
| Mr. Lior Davidson | Interim CFO | NA |
| Mr. Nachman Geva | Chief Technology Officer | NA |
| Gili Nizani | Vice Presudent of Marketing | NA |
| Mr. Alon Saban | Executive Vice President of Cybersecurity | 1972 |
| Major General Azriel Moscovich | Executive Director | 1965 |
| Mr. Ronit Hann | Company Secretary | NA |
| Mr. Nir Bar-Eli | Chief Executive Officer of Comsec Global | NA |
| Mr. Tuvia Grossman | General Counsel & Chief Legal Officer | 1981 |
Disclaimer - (*)This information, including any data, is sourced from Unicorn Data Services SAS, trading as EOD Historical Data (“EODHD”) on an ‘as is’ basis, using their API. We cannot guarantee the completeness or validity of the information and data provided on this page, as well as via the API. In some cases, the data may include analyst ratings or recommendations sourced through the EODHD API, which are intended solely for general information purposes.
This information does not consider your personal objectives, financial situation, or needs. Kalkine is not liable for any errors or omissions in the information provided or for any actions taken in reliance on it. You should seek advice from a financial adviser, stockbroker or other professional adviser (including taxation and legal advice) as necessary before acting on this information.

Download a free report with stock ideas and industry insights for general information.
Download Free Report Now →


Basic Materials
 +0.02%
Communication Services
 -0.63%

Consumer Cyclical
-0.11%

Consumer Defensive
-0.45%

Energy
+0.39%

Financial Services
-0.10%
Financials
-0.81%

Healthcare
+1.03%

Industrials
+0.32%

Real Estate
-0.31%

Technology
+0.59%

Utilities
-0.18%
Note: Daily price change (%) by sector excluding stocks with +/-90% daily price change. Companies above $500 million market capitalization are considered.
 Portfolio
 Watchlist


 Please wait processing your request...