
 CA
 NZ
 UK
 AU
 IND

 US

 Share
 X (Formerly Twitter)
 Whatsapp
 Facebook
 LinkedIn
 Telegram
 Email This Article
 Copy Link
 Summarize with AI
 Chat GPT
 Perplexity

Tower Semiconductor Ltd. (NASDAQ: TSEM), the Israel-based specialty foundry, is posting one of its strongest sessions in weeks. As of this chart snapshot (Wednesday, October 1, with about three hours left), shares are trading at $242.46, up $15.03 (+6.61%). The stock gapped up from Tuesday's close near $227.43 to open at $236.30, held above $233.00 all day, and has pushed to an intraday high of $246.82. The move lifts price clear of the two EMAs, which had converged near $225, and extends the recovery from the mid-September low. I could not find a company-specific catalyst for today's advance, so the case rests on the chart. 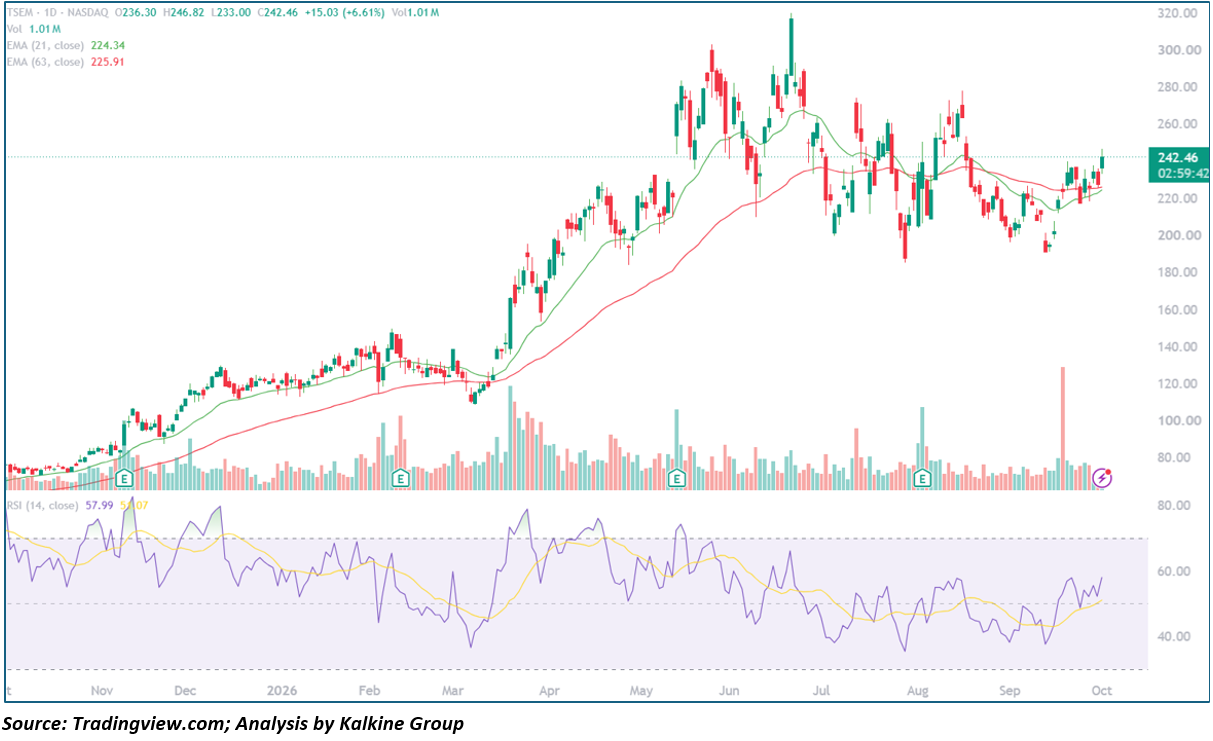
Key Highlights
- Trading at $242.46, up $15.03 (+6.61%), on partial-session Volume of 1.01M shares
- Opened at $236.30 (gap up), low of $233.00, high of $246.82
- 21-day EMA at $224.34 and 63-day EMA at $225.91, both below price
- 14-day RSI at 57.99, above its signal line near 51
- Resistance at $246.82 and $260; gap support at $236.30 and $227.43
Trend Structure: Three-Act Pattern
TSEM's Daily Chart over the past twelve months shows a steady climb, a parabolic spike and a wide repair range:
- Steady Advance (October 2025 – March 2026): The stock rose from roughly $70 in October to about $150 in February, with pullbacks to the rising EMAs repeatedly bought. A shakeout to about $110 in March tested the 63-day EMA and set the higher-low base for the next leg.
- Parabolic Spike (April – June 2026): The rally accelerated, taking the stock from about $110 to roughly $300 by late May and a peak near $320 in June, with RSI pushing above 75 at the highs. The Reversal followed quickly, with price falling back to about $200 by early July.
- Wide Range and Repair (July – October 2026): TSEM has since traded between roughly $185 and $280. A late-July low near $185 was followed by a rebound to about $278 in mid-August, which failed and gave way to a pullback to about $190 in mid-September. That low came with a large volume spike, which points to heavy buying near the bottom. The stock has since made a higher low, crossed above both EMAs, and pushed RSI from the 40s to the high 50s. Today's gap extends that recovery.
Backdrop
The chart carries Earnings markers near the major turns, and TSEM has moved sharply around reports. The next earnings release is typically due in early November, so confirm the date, as results are likely to be the next significant catalyst. The stock is still about 24% below its June peak, so today's strength is a recovery within a larger range rather than a new high.
Moving Averages and Momentum Profile
- Gap Dynamics: The stock opened at $236.30, held above its $233.00 low, and is trading near the highs. That pattern shows buyers in control all day, with no attempt to Fill the gap back toward $227.43.
- Moving Average Stack: The 21-day EMA ($224.34) and 63-day EMA ($225.91) are nearly flat and within about $1.60 of each other. Price is about 8% above both, so the EMAs are no longer immediate support. The 21-day remains slightly below the 63-day, so a bullish crossover has not yet occurred.
- Oscillator Behavior: RSI at 57.99 is above 50 and above its signal line, which points to improving momentum without being overbought. It remains well below the 75-plus readings seen at the May and June peaks.
- Volume Behavior: Volume of 1.01M is partial, with the session still open. A close on above-average volume would add weight to the breakout from the compression around the EMAs.
Key Technical Levels
|
Level |
Type |
Note |
|
$320 |
Resistance |
June cycle high |
|
$300–$303 |
Resistance |
Late-May high |
|
$278 |
Resistance |
Mid-August swing high |
|
$260–$265 |
Resistance |
Early-July and August rally highs |
|
$246.82 |
Resistance |
Today's intraday high |
|
$242.46 |
Reference |
Current price |
|
$236.30 |
Support |
Today's open, top of the gap |
|
$233.00 |
Support |
Today's low |
|
$227.43 |
Support |
Tuesday's close, bottom of the gap |
|
$225.91 |
Support |
63-day EMA |
|
$224.34 |
Support |
21-day EMA |
|
$190–$192 |
Support |
Mid-September low |
|
$185 |
Support |
Late-July cycle low |
Actionable Technical Outlook
- A daily close above $246.82 would extend the breakout and put the $260 to $265 zone in play, where two prior rallies stalled. A move through $278 would be needed to challenge the pattern of lower highs since June.
- Near-term structure stays constructive while the stock holds above the $236.30 gap top. A close back into the gap would signal fading conviction, with $227.43 and the EMAs near $224 to $226 as the next reference points.
- A close below the EMAs would turn today's move into a failed breakout and put the $190 to $192 low back in view.
- The stock has spent three months in a range between roughly $185 and $280, so mean-reverting moves remain more likely than a straight-line breakout until $280 is cleared.
- Because the session is still open, the closing price and volume could change this read. This is a technical read, not Investment advice.
Metadata
|
Field |
Value |
|
Headline |
Why is Tower Semiconductor (NASDAQ: TSEM) Gapping up 6.6% above its moving averages, and can it retest $260? |
|
SEO title |
Tower Semiconductor (TSEM) Gaps Up 6.6%: EMA Breakout Levels |
|
Meta description |
Tower Semiconductor (NASDAQ: TSEM) jumps 6.6% to $242.46 above its 21 and 63-day EMAs. RSI 58, key support and resistance levels for traders. |
|
Slug |
why-tower-semiconductor-tsem-nasdaq-stock-gapped-up-ema-breakout-levels |
|
Tags |
Tower Semiconductor, TSEM, NASDAQ, specialty foundry, semiconductors, technical analysis, moving averages |
|
Ticker |
TSEM |
|
Sector |
Information Technology |
|
Verification status |
PARTIAL (price levels read from the chart; catalyst not confirmed) |
|
Data as-of date |
October 1, 2026 (intraday) |


 Nov 07, 2026





 Please wait processing your request...