
 CA
 NZ
 UK
 AU
 IND

 US

 Share
 X (Formerly Twitter)
 Whatsapp
 Facebook
 LinkedIn
 Telegram
 Email This Article
 Copy Link
 Summarize with AI
 Chat GPT
 Perplexity

Sector: Information Technology (AI Cloud Infrastructure)
Nebius Group N.V. (NASDAQ: NBIS) is breaking down after months of tightening price action. As of this chart snapshot (about 56 minutes before the close), shares are trading at $208.07, down $13.00 (-5.88%), on partial-session Volume of 10.61M shares. The stock gapped down from Friday's close near $221.07 to open at $217.20, which was also the high of the day, and slid to a low of $206.90 without a real bounce. The drop takes price below the rising Trendline that has held since April, below the 63-day EMA and well below the 21-day EMA. I could not find a company-specific catalyst, so the case rests on the chart. 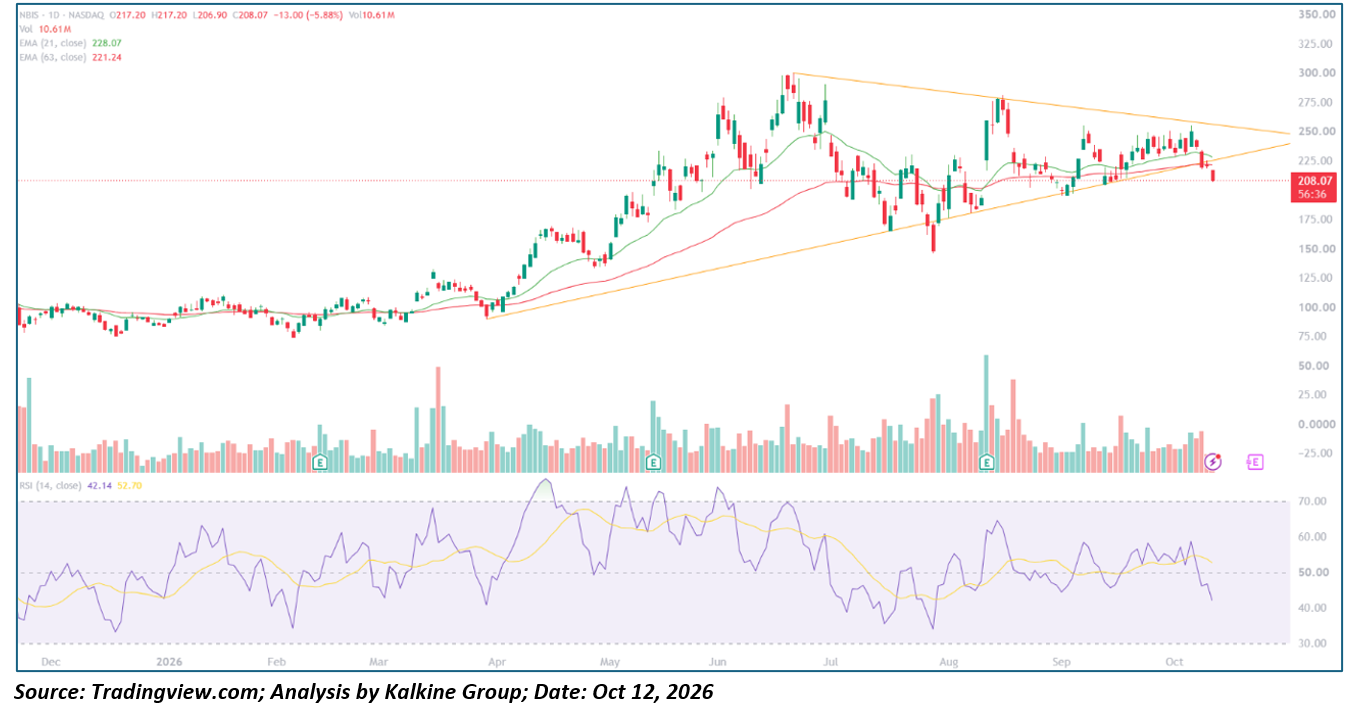
Key Highlights
- Trading at $208.07, down $13.00 (-5.88%), on partial-session volume of 10.61M shares
- Opened at $217.20 (gap down, at the session high), low of $206.90
- 21-day EMA at $228.07 and 63-day EMA at $221.24, both above price
- 14-day RSI at 42.14, below its 52.70 signal line and under 50
- Resistance at $221.24 and $228.07; support at $206.90, $195 and the July low near $165
Trend Structure: Three-Act Pattern
- Base and Drift (December 2025 – early April 2026): NBIS traded around $100 in December, drifted lower to about $75 in February, then ranged between roughly $85 and $110 through March. It bottomed near $90 in early April, the starting point of the rising trendline.
- Surge and Peak (April – June 2026): The stock rose about 230% in under three months, with RSI in the 70s along the way, and peaked near $300 in late June.
- Volatile Range and Compression (July – October 2026): A drop to about $147 in late July was followed by a sharp rebound after the August Earnings report, which carried the stock to about $280 on the heaviest volume of the chart. That peak was a lower high than June. NBIS then slid to about $195 in early September, and the range tightened between the falling resistance line near $250 and the rising support line. The stock reached about $255 in early October, and today's gap lower breaks the support line. The stock is about 31% below the June high and still about 130% above the April low.
Backdrop
The next quarterly earnings report is typically due in mid-November, so confirm the date. The earnings markers on the chart line up with some of the largest moves, including the mid-May advance and the August spike. The report is likely the next large catalyst. CoreWeave, Micron and SanDisk are also falling in the same session, so check for AI-infrastructure news that may explain the broad weakness.
Moving Averages and Momentum Profile
- Pattern Break: The stock had been compressing inside a symmetrical triangle, with a falling upper line from the June high and a rising lower line from the April low. Today's close below the lower line, which sat near $221 to $225, is the first break of that structure. A breakdown is more reliable if the stock closes below the line and fails to reclaim it.
- Moving Average Stack: The 21-day EMA ($228.07) is above the 63-day EMA ($221.24), but the two have been bunched for weeks, and price is now about 8.8% below the 21-day and 6.0% below the 63-day. Friday's close of $221.07 sat almost exactly on the 63-day EMA, so that level, which also marked the trendline, is now the key resistance.
- Candle Behavior: Today's candle is a large red bar that opened at its high and closed near its low, with a very small lower wick. There was no recovery attempt, which shows sellers in control all session.
- Oscillator Behavior: RSI at 42.14 has fallen from about 58 in early October and crossed below its signal line at 52.70. It has held between about 35 and 75 since April, so it is not oversold and has room to fall toward the 35 area that marked the August and September lows.
- Volume Behavior: Volume of 10.61M is partial, with the session still open. It is well below the August surge, so a close on rising volume would give the breakdown more weight.
Key Technical Levels
|
Level |
Type |
Note |
|
$300 |
Resistance |
Late-June cycle high (approximate) |
|
$280 |
Resistance |
Mid-August swing high (approximate) |
|
$255 |
Resistance |
Early-October swing high (approximate) |
|
$228.07 |
Resistance |
21-day EMA |
|
$221.24 |
Resistance |
63-day EMA and broken trendline area |
|
$221.07 |
Resistance |
Friday's close, top of the gap (derived from today's change) |
|
$208.07 |
Reference |
Current price |
|
$206.90 |
Support |
Today's low |
|
$195 |
Support |
Early-September swing low (approximate) |
|
$165 |
Support |
Mid-July swing low (approximate) |
Actionable Technical Outlook
- A close below today's low at $206.90 would extend the breakdown and put the $195 September low in play. A close below it would open the way toward the $165 July low, since the chart shows little support in between.
- A close back above $221 to $228, which is the 63-day EMA, the broken trendline and the 21-day EMA together, would turn the break into a false breakdown and put the $255 high back in view. Until then, rallies toward $221 are likely to meet sellers.
- Breakdowns from long triangles often retest the broken line before continuing, so a bounce toward $215 to $221 is possible. A rejection there would confirm the break. This is a technical read, not Investment advice.
Metadata
|
Field |
Value |
|
Headline |
Why is Nebius Group (NASDAQ: NBIS) falling 5.9% to $208.07 after breaking its triangle support, and can it hold $195? |
|
SEO title |
Nebius (NBIS) Falls 5.9% to $208.07: Triangle Breakdown and $195 Support |
|
Meta description |
Nebius Group (NASDAQ: NBIS) drops 5.9% to $208.07 after breaking its rising trendline. RSI 42, key support and resistance levels for traders. |
|
Slug |
why-nebius-nbis-nasdaq-stock-falls-triangle-breakdown-195-support |
|
Tags |
Nebius, NBIS, NASDAQ, AI cloud, technical analysis, moving averages, triangle breakdown, gap down |
|
Ticker / Sector |
NBIS / Information Technology |
|
Verification status |
PARTIAL (levels read from the chart; catalyst not confirmed) |
|
Data as-of date |
October 12, 2026 (intraday; chart snapshot taken October 13 at 00:33 IST, about 56 minutes before the US close) |
The chart's live countdown (56:36) shows the bar is the Monday, October 12 session still in progress, so update the price, low and volume if you publish after the close. Swing highs and lows and the trendline levels are approximate readings from the chart, and Friday's close is derived from today's change rather than read directly. The volume axis on this chart also shows negative values, which is a TradingView scaling quirk and does not affect the readings.


 Nov 07, 2026





 Please wait processing your request...