
 CA
 NZ
 UK
 AU
 IND

 US

 Share
 X (Formerly Twitter)
 Whatsapp
 Facebook
 LinkedIn
 Telegram
 Email This Article
 Copy Link
 Summarize with AI
 Chat GPT
 Perplexity

Advanced Energy Industries, Inc. (NASDAQ: AEIS), the Denver-based power conversion specialist, is having one of its stronger sessions in weeks. As of this chart snapshot (Wednesday, October 1, with about three hours left in the session), shares are trading at $292.11, up $10.29 (+3.65%). The stock opened at $282.25, probed a low of $280.33, and has pushed to an intraday high of $296.36. The advance has carried price straight into the 63-day EMA at $292.06, the level that capped each of the last several rallies. I could not find a company-specific catalyst for today's move, so the case rests on the chart. 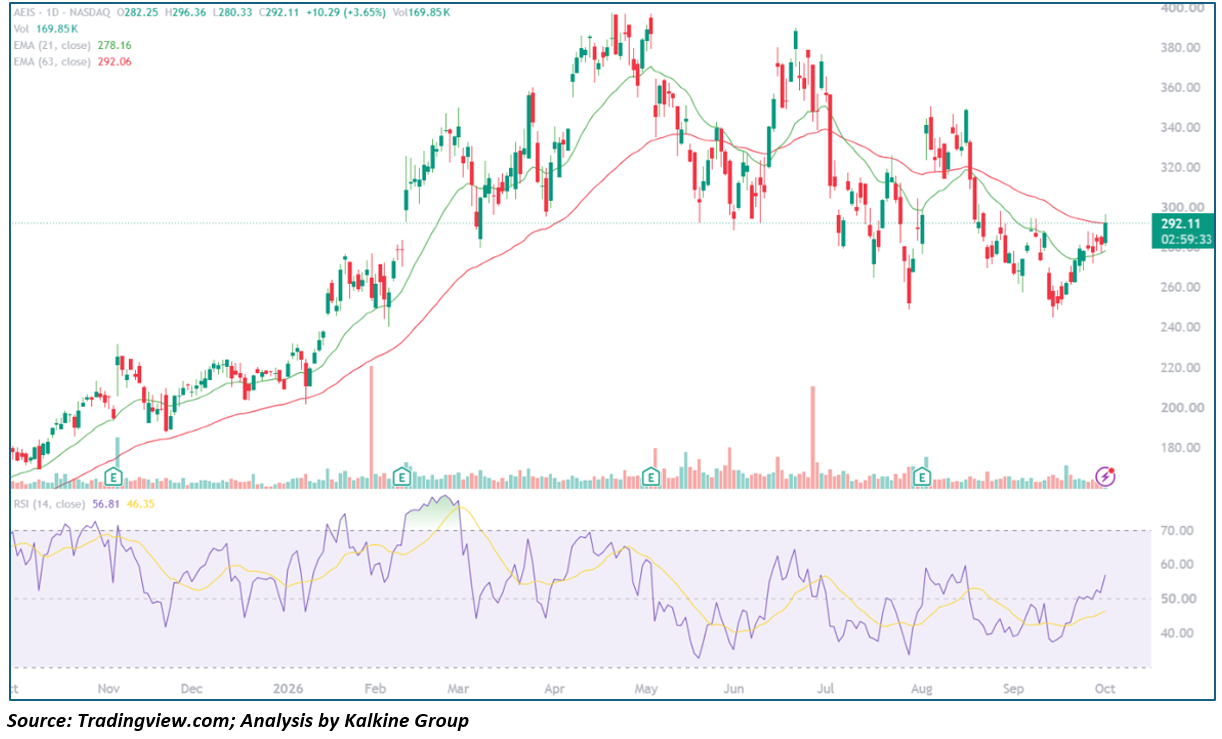
Key Highlights
- Trading at $292.11, up $10.29 (+3.65%), on partial-session Volume of 169.85K shares
- Opened at $282.25, low of $280.33, high of $296.36
- 21-day EMA at $278.16 (price now above it); 63-day EMA at $292.06 (price testing it)
- 14-day RSI at 56.81, above its 46.35 signal line
- Resistance at $296.36 and $300; support at $280 and $278
Trend Structure: Three-Act Pattern
AEIS's Daily Chart over the past twelve months shows a powerful advance, a volatile top, and a repair phase that is now being tested:
- Advance (October 2025 – April 2026): The stock climbed from the $170s in October to the mid-$300s by March, with pullbacks to the 63-day EMA repeatedly bought. The rally peaked near $397 in late April, with the 21-day EMA well above the 63-day EMA throughout. That peak matches the 52-week high of $397.44 reported on the Syfe quote page. syfe
- Volatile Top and Markdown (May – July 2026): Price pulled back to roughly $290 in late May, then rallied to about $390 in June. It could not hold that level and fell sharply in July to a low near $249, with the largest volume spikes of the year appearing during the selloff. The 21-day EMA crossed below the 63-day EMA, confirming the shift in trend.
- Lower Highs and Repair (August – October 2026): A bounce carried the stock to roughly $350 in mid-August, but it failed, and a weaker rally in early September stalled near $320. Shares then fell to a low near $245 in mid-September. Since that low, AEIS has made a series of higher lows, reclaimed the 21-day EMA, and pushed RSI from the high 30s to the high 50s. Today's candle is the first to test the 63-day EMA cleanly.
Backdrop
Sell-side sentiment has stayed constructive through the drawdown. In early August, Seaport Global upgraded the stock to Buy from Neutral with a $410 price target, and Morgan Stanley raised its target to $439 from $421 while keeping an Overweight rating. Those targets sit far above current levels, but analyst targets do not by themselves move price. The next Earnings report is typically due in late October or early November, so confirm the date, as results are likely to be the next major catalyst. syfesyfe
Moving Averages and Momentum Profile
- Moving Average Stack: Price at $292.11 is about 5% above the 21-day EMA ($278.16) and essentially on top of the 63-day EMA ($292.06). The 21-day is still below the 63-day, so the longer-term trend remains negative until the faster average crosses back above.
- Oscillator Behavior: RSI at 56.81 has crossed above 50 and sits well above its 46.35 signal line, a sign that momentum is improving without being overbought.
- Volume Behavior: Volume of 169.85K is partial, with the session still open, so confirmation will depend on the final tally. A close above the 63-day EMA on volume at or above the recent average would carry more weight than a thin push.
- Candle Structure: The stock opened near its low and has trended higher all day, a one-directional move that shows buyers in control so far.
Key Technical Levels
|
Level |
Type |
Note |
|
$350 |
Resistance |
Mid-August swing high |
|
$320–$325 |
Resistance |
Early-September failed rally |
|
$300 |
Resistance |
Round number; prior rejection zone |
|
$296.36 |
Resistance |
Today's intraday high |
|
$292.11 |
Reference |
Current price |
|
$292.06 |
Resistance/Pivot |
63-day EMA |
|
$282.25 |
Support |
Today's open |
|
$280.33 |
Support |
Today's low |
|
$278.16 |
Support |
21-day EMA |
|
$245–$249 |
Support |
September low and July low |
Actionable Technical Outlook
- A daily close above the 63-day EMA and above $296.36 would be the first evidence that the September low is a durable bottom. The next test would be $300, then the $320 to $325 area.
- Near-term structure stays constructive while the stock holds above $280 and the 21-day EMA near $278. A close back below that zone would turn today's move into a failed test of the 63-day EMA.
- A rejection here would fit the pattern of the past few months, in which every rally into the 63-day EMA has failed. Traders should watch for a Reversal candle or fading volume near $296 to $300.
- The $245 to $249 double low remains the key floor for the broader recovery thesis.
- Because the session is still open, the closing price and volume could change this read. This is a technical read, not Investment advice.
Metadata
|
Field |
Value |
|
Headline |
Why is Advanced Energy (NASDAQ: AEIS) up 3.7% into its 63-day EMA, and can it clear $300? |
|
SEO title |
Advanced Energy (AEIS) Rallies 3.7%: 63-Day EMA and $300 Levels |
|
Meta description |
Advanced Energy (NASDAQ: AEIS) jumps 3.7% to $292 and tests its 63-day EMA. RSI 56.8, key support and resistance levels for traders. |
|
Slug |
why-advanced-energy-aeis-nasdaq-stock-rallied-63-day-ema-300-levels |
|
Tags |
Advanced Energy, AEIS, NASDAQ, power electronics, semiconductor equipment, technical analysis, moving averages |
|
Ticker |
AEIS |
|
Sector |
Information Technology |
|
Verification status |
PARTIAL (price levels read from the chart; catalyst not confirmed) |
|
Data as-of date |
October 1, 2026 (intraday) |


 Nov 09, 2026





 Please wait processing your request...