
 CA
 NZ
 UK
 AU
 IND

 US

 Share
 X (Formerly Twitter)
 Whatsapp
 Facebook
 LinkedIn
 Telegram
 Email This Article
 Copy Link
 Summarize with AI
 Chat GPT
 Perplexity

Price Action, Trend Structure, and Momentum Outlook
ONTO Inc. (NYSE: ONTO) — Bullish Trend Remains Intact Despite Sharp Profit-Taking Following a Strong Breakout to New Highs
Key Highlights
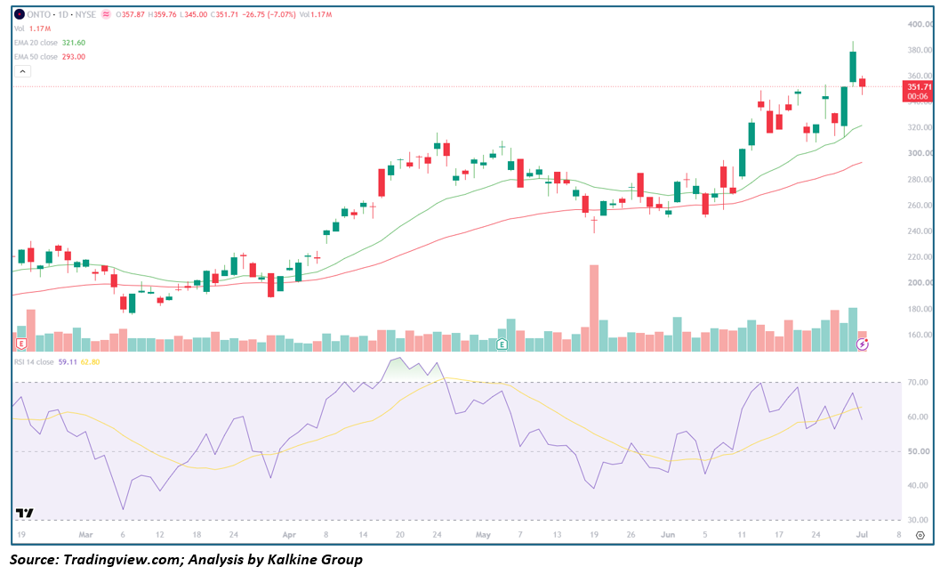
• ONTO closed at $352.63, down 6.82%, after a sharp round of profit-taking following a powerful multi-week rally.
• The stock continues to trade well above both the 20-day EMA ($321.69) and 50-day EMA ($293.03), confirming that the broader intermediate-term trend remains bullish.
• RSI has eased to around 59, moving lower from recent highs but remaining comfortably above the neutral 50 level, indicating that bullish momentum has moderated rather than reversed.
• Recent price action pushed the stock to fresh highs near $380 before encountering aggressive selling, suggesting the emergence of short-term resistance.
• Volume expanded during both the rally and the latest decline, reflecting increased market participation and profit booking after an extended advance.
Trend Structure
ONTO has maintained one of the strongest technical structures among semiconductor equipment stocks over the past several months. After spending March in a broad consolidation phase, the stock established a solid base above its 50-day EMA before beginning a sustained advance throughout April and May. During this period, buyers consistently defended pullbacks toward the 20-day EMA, creating a series of higher highs and higher lows that confirmed a healthy bullish trend.
Momentum accelerated sharply during June as price broke above previous resistance levels with expanding volume. Large bullish candles demonstrated strong institutional demand, ultimately carrying the stock toward the $380 area. However, after such a steep advance, sellers emerged aggressively near fresh highs, triggering the latest pullback. While the decline appears significant on a single-day basis, it currently resembles normal profit-taking following an extended rally rather than the beginning of a trend reversal.
The bullish alignment of both moving averages remains one of the strongest technical positives. The 20-day EMA continues to trade well above the 50-day EMA while both averages maintain positive slopes, reflecting sustained buying pressure. RSI has cooled from near-overbought levels but remains above the midpoint, suggesting momentum remains constructive despite recent weakness.
Key Technical Levels
Resistance
• $365–380 – Recent swing high and immediate resistance
• $390–400 – Psychological breakout zone
Support
• $335–340 – Initial support
• $321 – 20-day EMA
• $293 – 50-day EMA
Outlook
As long as ONTO remains above its rising 20-day EMA, the broader bullish structure remains intact. Short-term consolidation or additional profit-taking would likely represent a healthy reset following the recent breakout. A decisive move back above $380 could signal the continuation of the primary uptrend, while a sustained close below the 20-day EMA would increase the probability of a deeper retracement toward the 50-day EMA before buyers regain control.
KLA Corporation (NASDAQ: KLAC) — Strong Long-Term Uptrend Faces Healthy Correction After Testing Record Highs
Key Highlights
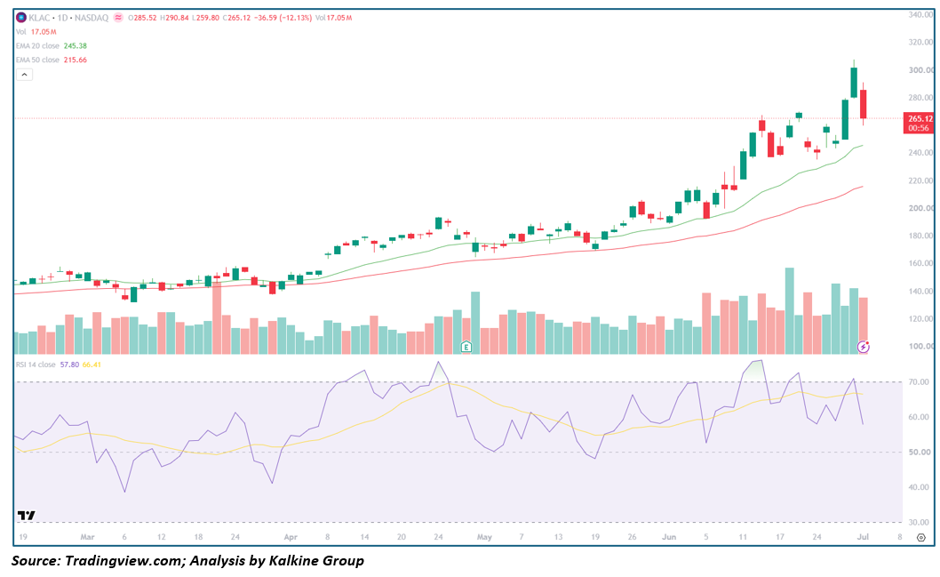
• KLAC closed at $262.62, declining 12.96% after an extended rally pushed the stock to fresh all-time highs.
• Price continues to trade above both the 20-day EMA ($245.14) and 50-day EMA ($215.56), preserving the broader bullish trend.
• RSI has declined to approximately 57, indicating cooling momentum while remaining in constructive territory.
• Recent selling appears to be driven primarily by profit-taking after an exceptionally strong June advance.
• Volume expanded significantly during the latest correction, highlighting active participation as traders locked in gains.
Trend Structure
KLAC has maintained a remarkably strong bullish trend over recent months, consistently producing higher highs and higher lows while remaining above both major moving averages. Following a period of consolidation during April and early May, buyers regained control, driving the stock steadily higher through June. Each pullback attracted fresh buying interest near the 20-day EMA, reinforcing the strength of the prevailing uptrend.
Momentum accelerated during the second half of June as several large bullish candles carried the stock beyond the psychological $300 level. Strong trading volume confirmed institutional participation and validated the breakout. However, after becoming extended above its short-term moving averages, the stock experienced a sharp round of profit-taking that produced the latest large bearish candle.
Despite the magnitude of this decline, the broader technical picture remains constructive. Price continues to hold comfortably above both moving averages, while the 20-day EMA remains firmly above the 50-day EMA. This positive alignment indicates that the recent weakness is currently a correction within an ongoing uptrend rather than a structural breakdown.
The RSI has retreated from overbought territory but remains above 50, suggesting momentum has cooled without turning bearish. Continued consolidation above the 20-day EMA would allow technical indicators to reset while preserving the longer-term bullish structure.
Key Technical Levels
Resistance
• $280–300 – Immediate resistance
• Above $300 – New breakout territory
Support
• $245 – 20-day EMA
• $230–235 – Previous breakout area
• $216 – 50-day EMA
Outlook
The current pullback appears consistent with a healthy correction following a strong momentum-driven rally. As long as buyers defend the 20-day EMA, the primary trend remains bullish. A successful consolidation could eventually provide the foundation for another advance toward recent highs, whereas a decisive break below the 20-day EMA would increase the likelihood of a deeper correction toward the rising 50-day EMA.
Allegro MicroSystems (NASDAQ: ALGM) — Bullish Structure Holds Firm as Momentum Cools Following Powerful June Breakout
Key Highlights
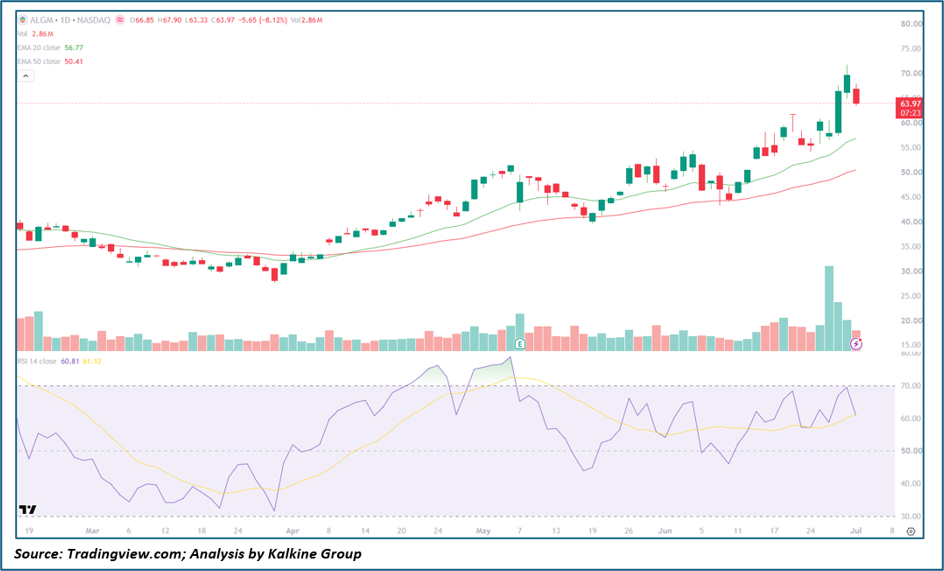
• ALGM closed at $63.97, falling 8.12% after reaching fresh multi-month highs near $70.
• The stock remains above both the 20-day EMA ($56.77) and 50-day EMA ($50.41), confirming that the intermediate-term trend remains positive.
• RSI has eased to around 61, reflecting slowing momentum while remaining firmly in bullish territory.
• Strong volume accompanied the recent breakout, followed by moderate profit-taking near resistance.
• The broader sequence of higher highs and higher lows continues to support the bullish technical outlook.
Trend Structure
ALGM spent much of the first quarter establishing a long-term base before beginning a steady recovery during April. As buyers gradually regained control, price reclaimed both the 20-day and 50-day EMAs, marking an important shift in trend direction. Since then, every meaningful pullback has attracted buying interest, allowing the stock to build a well-defined pattern of higher highs and higher lows.
The rally strengthened considerably throughout June as buyers pushed the stock through multiple resistance levels with increasing momentum. Rising trading volume confirmed growing institutional participation, while the widening distance between the 20-day and 50-day EMAs reflected improving trend strength. The advance eventually carried ALGM toward the $70 area before encountering selling pressure.
The latest decline appears to represent normal profit-taking after a strong breakout rather than widespread distribution. Importantly, price continues to trade comfortably above both moving averages, while the overall trend remains firmly intact. RSI has moderated from recent highs but remains above the neutral level, suggesting bullish momentum continues to dominate despite the recent pullback.
Volume analysis also supports a constructive interpretation. Elevated buying activity during the breakout indicates strong demand, while recent selling has yet to demonstrate the sustained heavy distribution typically associated with major trend reversals.
Key Technical Levels
Resistance
• $68–70 – Recent swing high
• Above $70 – Breakout continuation
Support
• $58–60 – Initial support
• $56.77 – 20-day EMA
• $50.41 – 50-day EMA
Outlook
ALGM continues to display one of the healthier technical structures within its peer group. The recent decline appears to be a normal consolidation following an extended rally, allowing momentum indicators to cool while preserving the broader uptrend. Holding above the 20-day EMA would reinforce bullish sentiment and keep the path open for another attempt toward the recent highs. Conversely, a sustained break below the 20-day EMA could trigger a deeper retracement toward the rising 50-day EMA, although the longer-term technical outlook would remain positive unless that support is also violated.


 Nov 06, 2026





 Please wait processing your request...