
 CA
 NZ
 UK
 AU
 IND

 US

 Share
 X (Formerly Twitter)
 Whatsapp
 Facebook
 LinkedIn
 Telegram
 Email This Article
 Copy Link
 Summarize with AI
 Chat GPT
 Perplexity

Today's session produced a divergence in market action across hyperscale enterprise cloud, consumer tech, and decentralized infrastructure platforms, with intraday price performances ranging from modest defensive gains (+0.52%) to focused pullbacks between -0.80% and -3.11%. Following multi-month uptrends and late-summer base formations, four marquee tech and software leaders—Microsoft Corp. (NASDAQ: MSFT), Apple Inc. (NASDAQ: AAPL), Oracle Corp. (NYSE: ORCL), and Circle Internet Financial / Corcell (NYSE: CRCL)—are testing critical dynamic inflection zones defined by their 21-day and 63-day exponential moving averages (EMAs).
Microsoft maintained positive posture by defending the $500.00 psychological threshold, holding dynamic support above its rising 21-day EMA. Apple experienced a minor mean-reversion pullback of -0.80% after testing major Fibonacci extension resistance near $343.00, preserving a clean golden-cross EMA stack. Circle (CRCL) and Oracle pulled back -3.03% and -3.11% respectively, with CRCL testing its short-term 21-day EMA cushion following a strong multi-week run, while ORCL slipped beneath its converging dynamic moving averages to retest multi-week range support. Across the board, these institutional benchmarks are navigating key technical tests, with relative strength separating names in active trend expansions from those undergoing range-bound consolidation.
Microsoft Corporation (NASDAQ: MSFT) — Defending the $500 Psychological Shelf
Key Highlights
- MSFT is trading at $500.59, advancing +0.52% (+$2.59) on Volume of 19.27M shares, oscillating between a session low of $495.88 and an intraday high of $509.44.
- Price action continues to ride above both its rising 21-day EMA ($494.43) and 63-day EMA ($466.29), sustaining the bullish golden-cross alignment initiated in early August.
- The 14-day RSI reads 56.30, tracking near its 56.86 signal line and holding constructive territory above the 50 neutral mark.
- After dropping to a summer Capitulation low near $350.00 in late June 2026, MSFT engineered a massive V-shaped recovery throughout July and August to reclaim the $500.00 level.
- Today’s candle represents a defense of the local consolidation shelf following a test of the late-summer swing highs near $520.00.
Trend Structure
Microsoft’s Daily Chart demonstrates a strong intermediate-term uptrend that has transitioned into a high-level consolidation pattern. The steep impulse rally off the summer lows flattened out into an orderly bull flag between $490.00 and $520.00. The ascending 21-day EMA continues to provide consistent dynamic demand, preventing sellers from establishing lower daily lows and confirming that institutional accumulation remains steady. 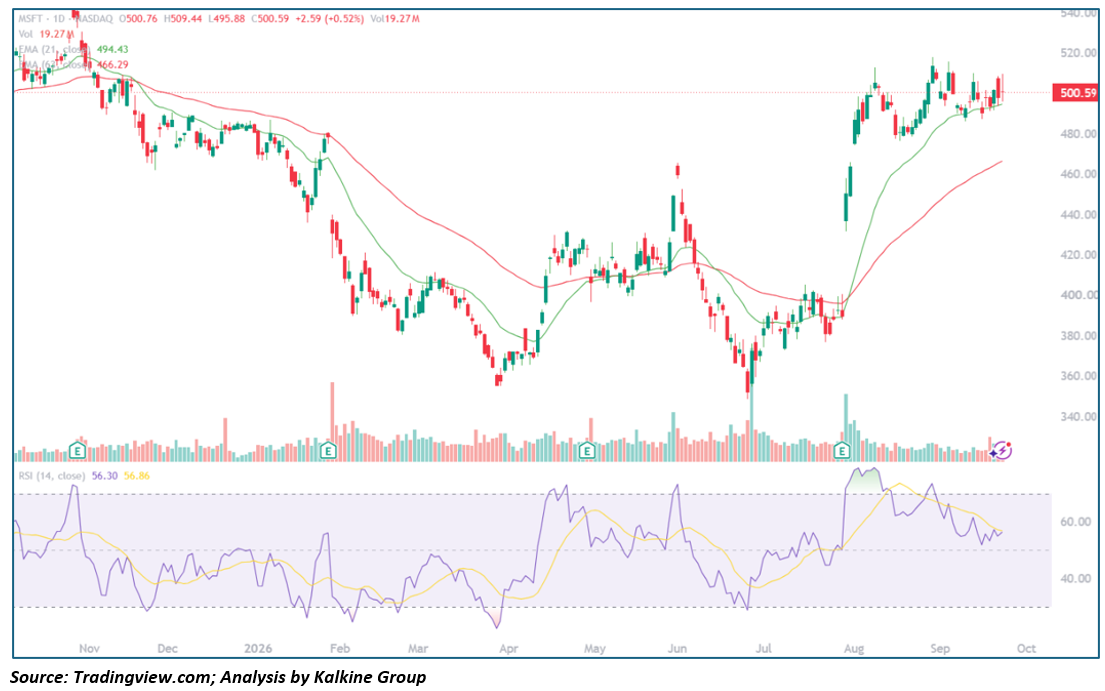
Key Technical Levels
- Resistance:
- $509.44–$520.00: Intraday session high and late-summer swing double-top.
- $530.00: Structural overhead barrier from late 2025.
- $540.00+: Historical all-time high zone.
- Support:
- $494.43–$495.88: Session low and dynamic 21-day EMA baseline.
- $480.00: Horizontal flag support floor.
- $466.29: Primary 63-day EMA Trendline anchor.
Outlook
MSFT's posture favors an eventual upside continuation toward $520.00–$530.00 as long as the price defends the rising 21-day EMA ($494.43) on a daily closing basis. A breakdown beneath $490.00 would trigger a deeper mean-reversion retest toward the 63-day EMA at $466.29.
Apple Inc. (NASDAQ: AAPL) — Orderly Pullback Off the 1.618 Fibonacci Extension
Key Highlights
- AAPL is trading at $337.02, dipping -0.80% (-$2.73) on turnover of 31.37M shares, moving within an intraday channel between $335.50 and $341.80.
- Price remains well above its upward-sloping 21-day EMA ($328.10) and 63-day EMA ($316.92), preserving intermediate trend alignment.
- The 14-day RSI sits at 62.94, tracking slightly above its 60.84 signal line and maintaining healthy bullish altitude without extreme overbought readings.
- After staging an ascending staircase rally from its summer low near $275.00, AAPL rallied directly into the 1.618 Fibonacci extension level at $343.19.
- Today's minor pullback reflects routine profit-taking and digestion following the multi-week breakout above $330.00.
Trend Structure
Apple’s chart presents an established structural uptrend characterized by higher swing highs and higher swing lows. The rejection at the 1.618 Fibonacci extension ($343.19) represents technical resistance absorption rather than trend exhaustion. Moving averages are diverging in a bullish trajectory, with the rising 21-day EMA serving as dynamic intermediate support. 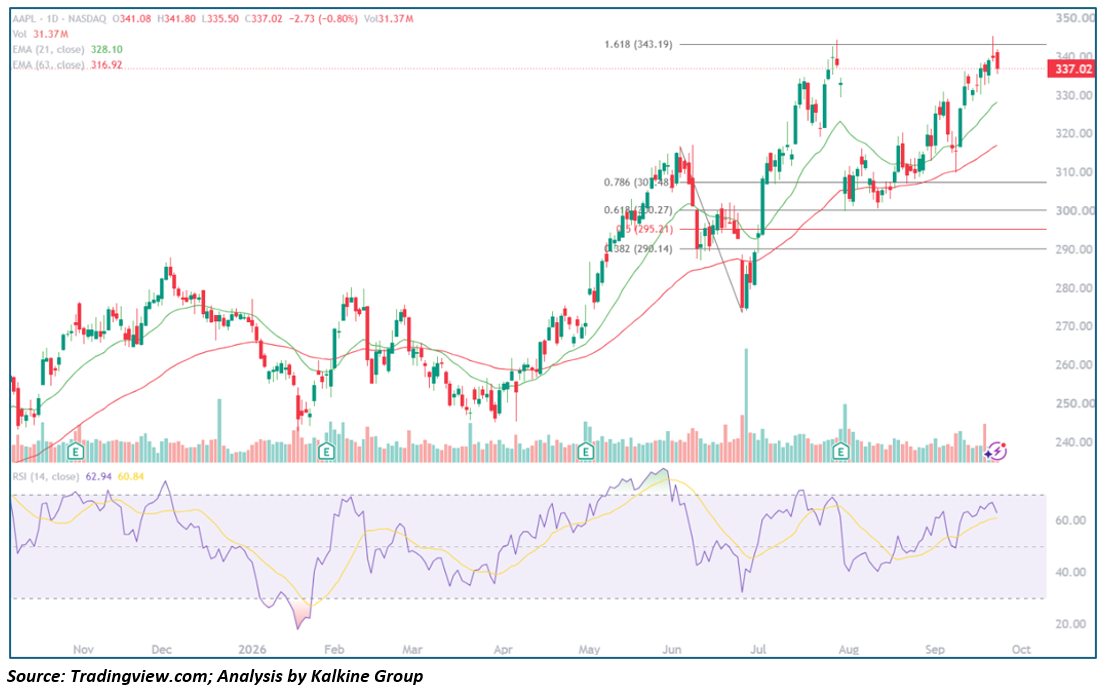
Key Technical Levels
- Resistance:
- $341.80–$343.19: Intraday high and major 1.618 Fibonacci extension ceiling.
- $350.00: Psychological round number.
- $360.00: Upper channel boundary projection.
- Support:
- $335.50: Intraday session low.
- $328.10: Dynamic 21-day EMA support shelf.
- $316.92: Rising 63-day EMA primary trend anchor.
Outlook
AAPL remains in a dominant bullish expansion phase. A clean breakout and daily close above the $343.19 Fibonacci level opens the door toward $350.00–$360.00. In the near term, dips toward $328.00–$330.00 offer dynamic Demand zones backed by moving-average support.
Circle / Corcell (NYSE: CRCL) — Pullback Testing the 21-Day Dynamic Support
Key Highlights
- CRCL is trading at $91.72, declining -3.03% (-$2.87) on volume of 10.64M shares, oscillating between a session low of $91.53 and an intraday peak of $97.45.
- Price has pulled back toward its ascending 21-day EMA ($89.25) while maintaining elevation above its rising 63-day EMA ($83.91).
- The 14-day RSI has cooled to 53.56, tracking just beneath its 56.31 signal line to reach neutral-bullish equilibrium.
- After carving out a double-bottom base near $60.00 in July 2026, CRCL staged a high-volume breakout in late August, advancing to test the $100.00 mark before pausing.
- Today's sell-off marks a mean-reversion retest of the breakout base following recent Supply rejections near $100.00.
Trend Structure
CRCL exhibits a constructive cup-and-handle/rounding Reversal off summer lows. The cross of the 21-day EMA above the 63-day EMA in late August confirmed an intermediate trend shift. Although the stock encountered profit-taking at the psychological $100.00 ceiling, the current pullback is orderly and remains supported above the dynamic 21-day EMA. 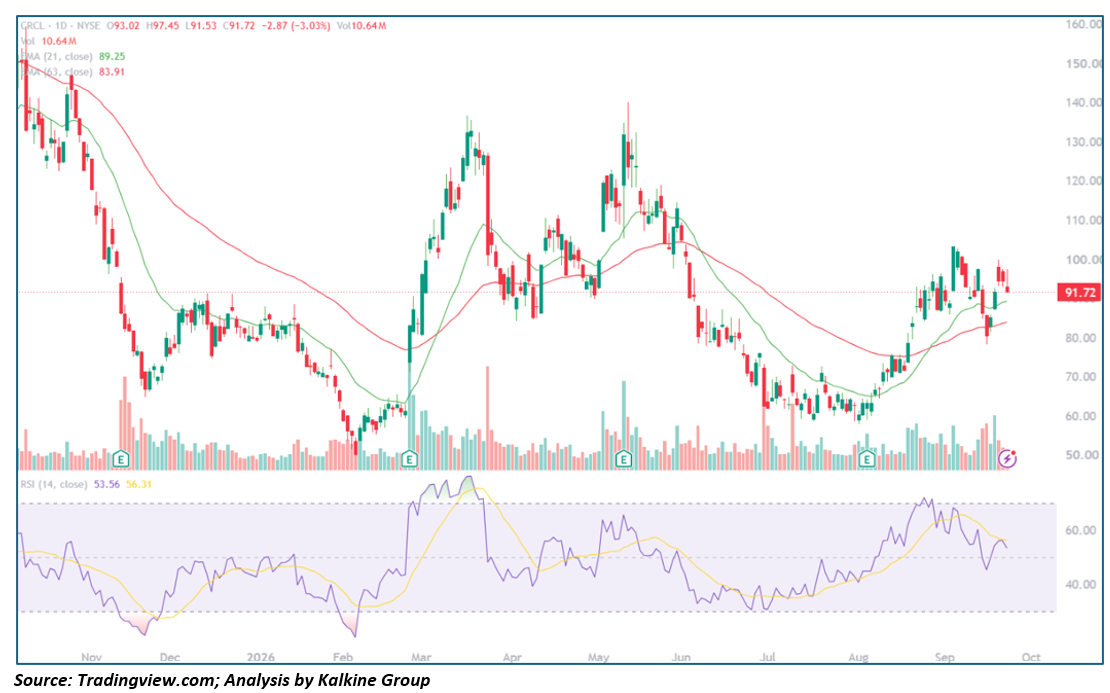
Key Technical Levels
- Resistance:
- $97.45–$100.00: Session high and major psychological supply ceiling.
- $115.00–$120.00: Intermediate breakdown resistance from May/June 2026.
- $140.00: Spring 2026 cycle high.
- Support:
- $91.53: Session intraday low.
- $89.25: Dynamic 21-day EMA support cushion.
- $83.91: Dynamic 63-day EMA trend floor.
Outlook
CRCL's intermediate structure remains positive as long as price holds above the 21-day EMA ($89.25). A confirmed defense of this shelf and subsequent breakout above $100.00 targets the $110.00–$115.00 zone. A daily close below $89.00 would open a deeper retest of the 63-day EMA at $83.91.
Oracle Corporation (NYSE: ORCL) — Compression and Retest of Multi-Week Range Floor
Key Highlights
- ORCL is trading at $144.56, sliding -3.11% (-$4.64) on volume of 22.10M shares, ranging between an intraday low of $144.23 and a high of $148.66.
- Price has slipped beneath both its 21-day EMA ($148.09) and 63-day EMA ($150.31), returning to the lower boundary of its multi-month horizontal channel.
- The 14-day RSI has dropped to 46.73, slipping below its 52.45 signal line into mildly bearish territory.
- After dropping from early-summer highs of $240.00 to a capitulation low near $120.00 in July, ORCL rebounded to consolidate between $140.00 and $165.00 across August and September.
- Today’s decline re-engages the horizontal support shelf near $140.00–$144.00 following a failed breakout attempt toward $165.00.
Trend Structure
Oracle's daily chart reflects an extended base-building consolidation pattern characterized by low-conviction range-bound chop. The converging 21-day and 63-day EMAs are largely flat, indicating trend neutrality. Today's rejection from the moving-average band reinforces the $150.00 level as dynamic resistance, while keeping price pinned in its multi-week trading range. 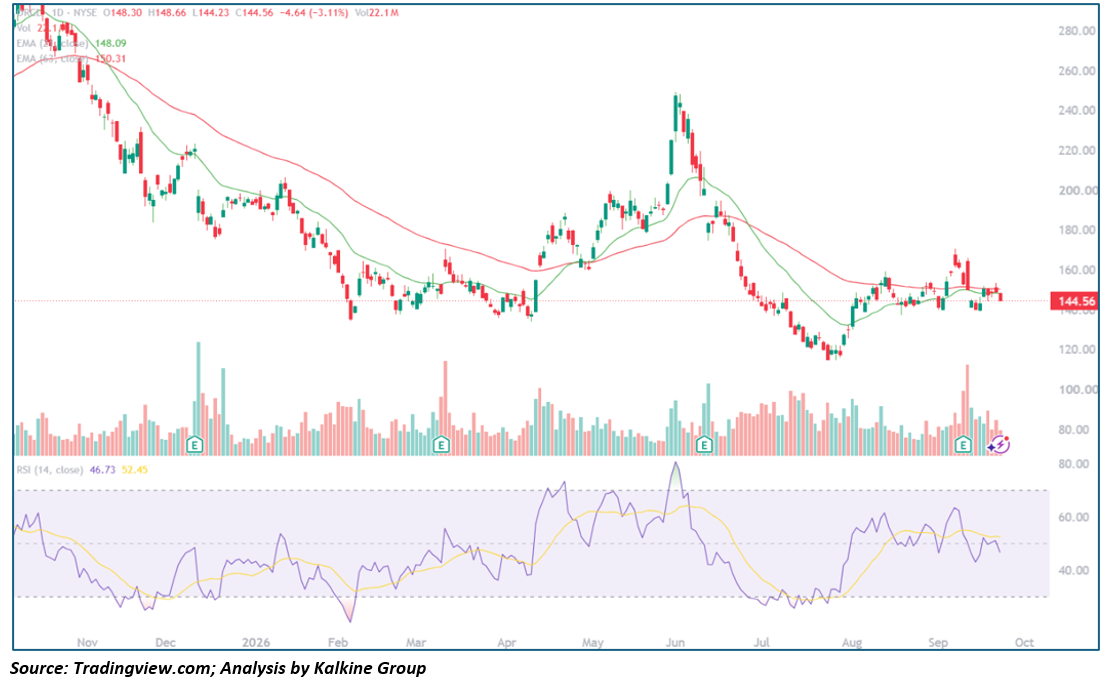
Key Technical Levels
- Resistance:
- $148.09–$150.31: Dynamic confluence of the 21-day and 63-day EMAs.
- $160.00–$165.00: Recent swing high and horizontal distribution ceiling.
- $180.00–$190.00: Structural summer breakdown shelf.
- Support:
- $144.23: Intraday session low.
- $140.00: Multi-week horizontal range base.
- $120.00–$125.00: July 2026 capitulation cycle low.
Outlook
ORCL remains trapped within a sideways channel. Buyers must defend the $140.00 horizontal floor to avoid a retest of the summer lows at $120.00. A sustained close above the 63-day EMA ($150.31) is required to unlock upward momentum toward $165.00.
Comparative Technical Summary: Big Tech & Cloud Titans
|
Ticker |
Last Price |
Intraday Change |
21-Day EMA |
63-Day EMA |
14-Day RSI |
Technical Classification |
|---|---|---|---|---|---|---|
|
MSFT |
$500.59 |
+0.52% |
$494.43 |
$466.29 |
56.30 |
High-Level Consolidation / Dynamic Defense |
|
AAPL |
$337.02 |
-0.80% |
$328.10 |
$316.92 |
62.94 |
Bullish Uptrend / Fibonacci Resistance Digestion |
|
CRCL |
$91.72 |
-3.03% |
$89.25 |
$83.91 |
53.56 |
Base Reversal / Dynamic 21-Day EMA Pullback |
|
ORCL |
$144.56 |
-3.11% |
$148.09 |
$150.31 |
46.73 |
Range-Bound Churn / Moving-Average Loss |
This analysis is based on daily chart technical indicators (21/63-day EMAs, RSI-14) and price action as of September 23, 2026, and is intended strictly for educational and informational purposes — not individual Investment advice.


 Nov 08, 2026





 Please wait processing your request...