
 CA
 NZ
 UK
 AU
 IND

 US

 Share
 X (Formerly Twitter)
 Whatsapp
 Facebook
 LinkedIn
 Telegram
 Email This Article
 Copy Link
 Summarize with AI
 Chat GPT
 Perplexity

Key Momentum Shifts
- Technology Remains Leading: Information Technology (XLK) remains the only sector in the Leading quadrant, although its latest trajectory continues to turn lower.
- Health Care Remains Improving: Health Care (XLV) remains positioned in Improving, although its latest trajectory has moderated.
- Industrials Remain Improving: Industrials (XLI) continues to occupy Improving, indicating relatively stronger momentum despite remaining outside Leading.
- Communication Services Remains Weakening: Communication Services (XLC) remains below the horizontal midpoint and continues to sit in Weakening.
- Seven Sectors Remain Lagging: Energy, Consumer Staples, Consumer Discretionary, Real Estate, Materials, Utilities and Financials remain in the Lagging quadrant.
- Utilities Lead Daily Performance: XLU gained 1.17%, recording the strongest daily performance among the eleven sectors.
- Energy Underperforms: XLE declined 0.90%, the weakest daily performance, despite remaining in Lagging.
- Technology Nearly Unchanged: XLK declined only 0.02% while retaining its Leading position.
- Momentum Divergence: Daily sector performance continues to differ from broader relative momentum, with several sectors recording positive returns while remaining in Lagging.
The latest Relative Rotation Graph for 29 September 2026 shows a concentrated momentum structure across US sectors. Technology remains the only sector positioned in Leading, while Industrials and Health Care occupy Improving. Communication Services remains in Weakening, while Energy continues to sit in Lagging alongside six other sectors. The chart therefore continues to show a clear concentration of relative strength in a small number of market segments.
The chart also demonstrates that daily performance does not necessarily correspond with broader relative momentum. Utilities gained 1.17% during the latest session but remain in Lagging, while Technology was almost unchanged and retained its Leading position. This divergence highlights the difference between one-session price performance and the broader momentum relationship captured by the RRG.
Momentum Breakdown by Quadrant
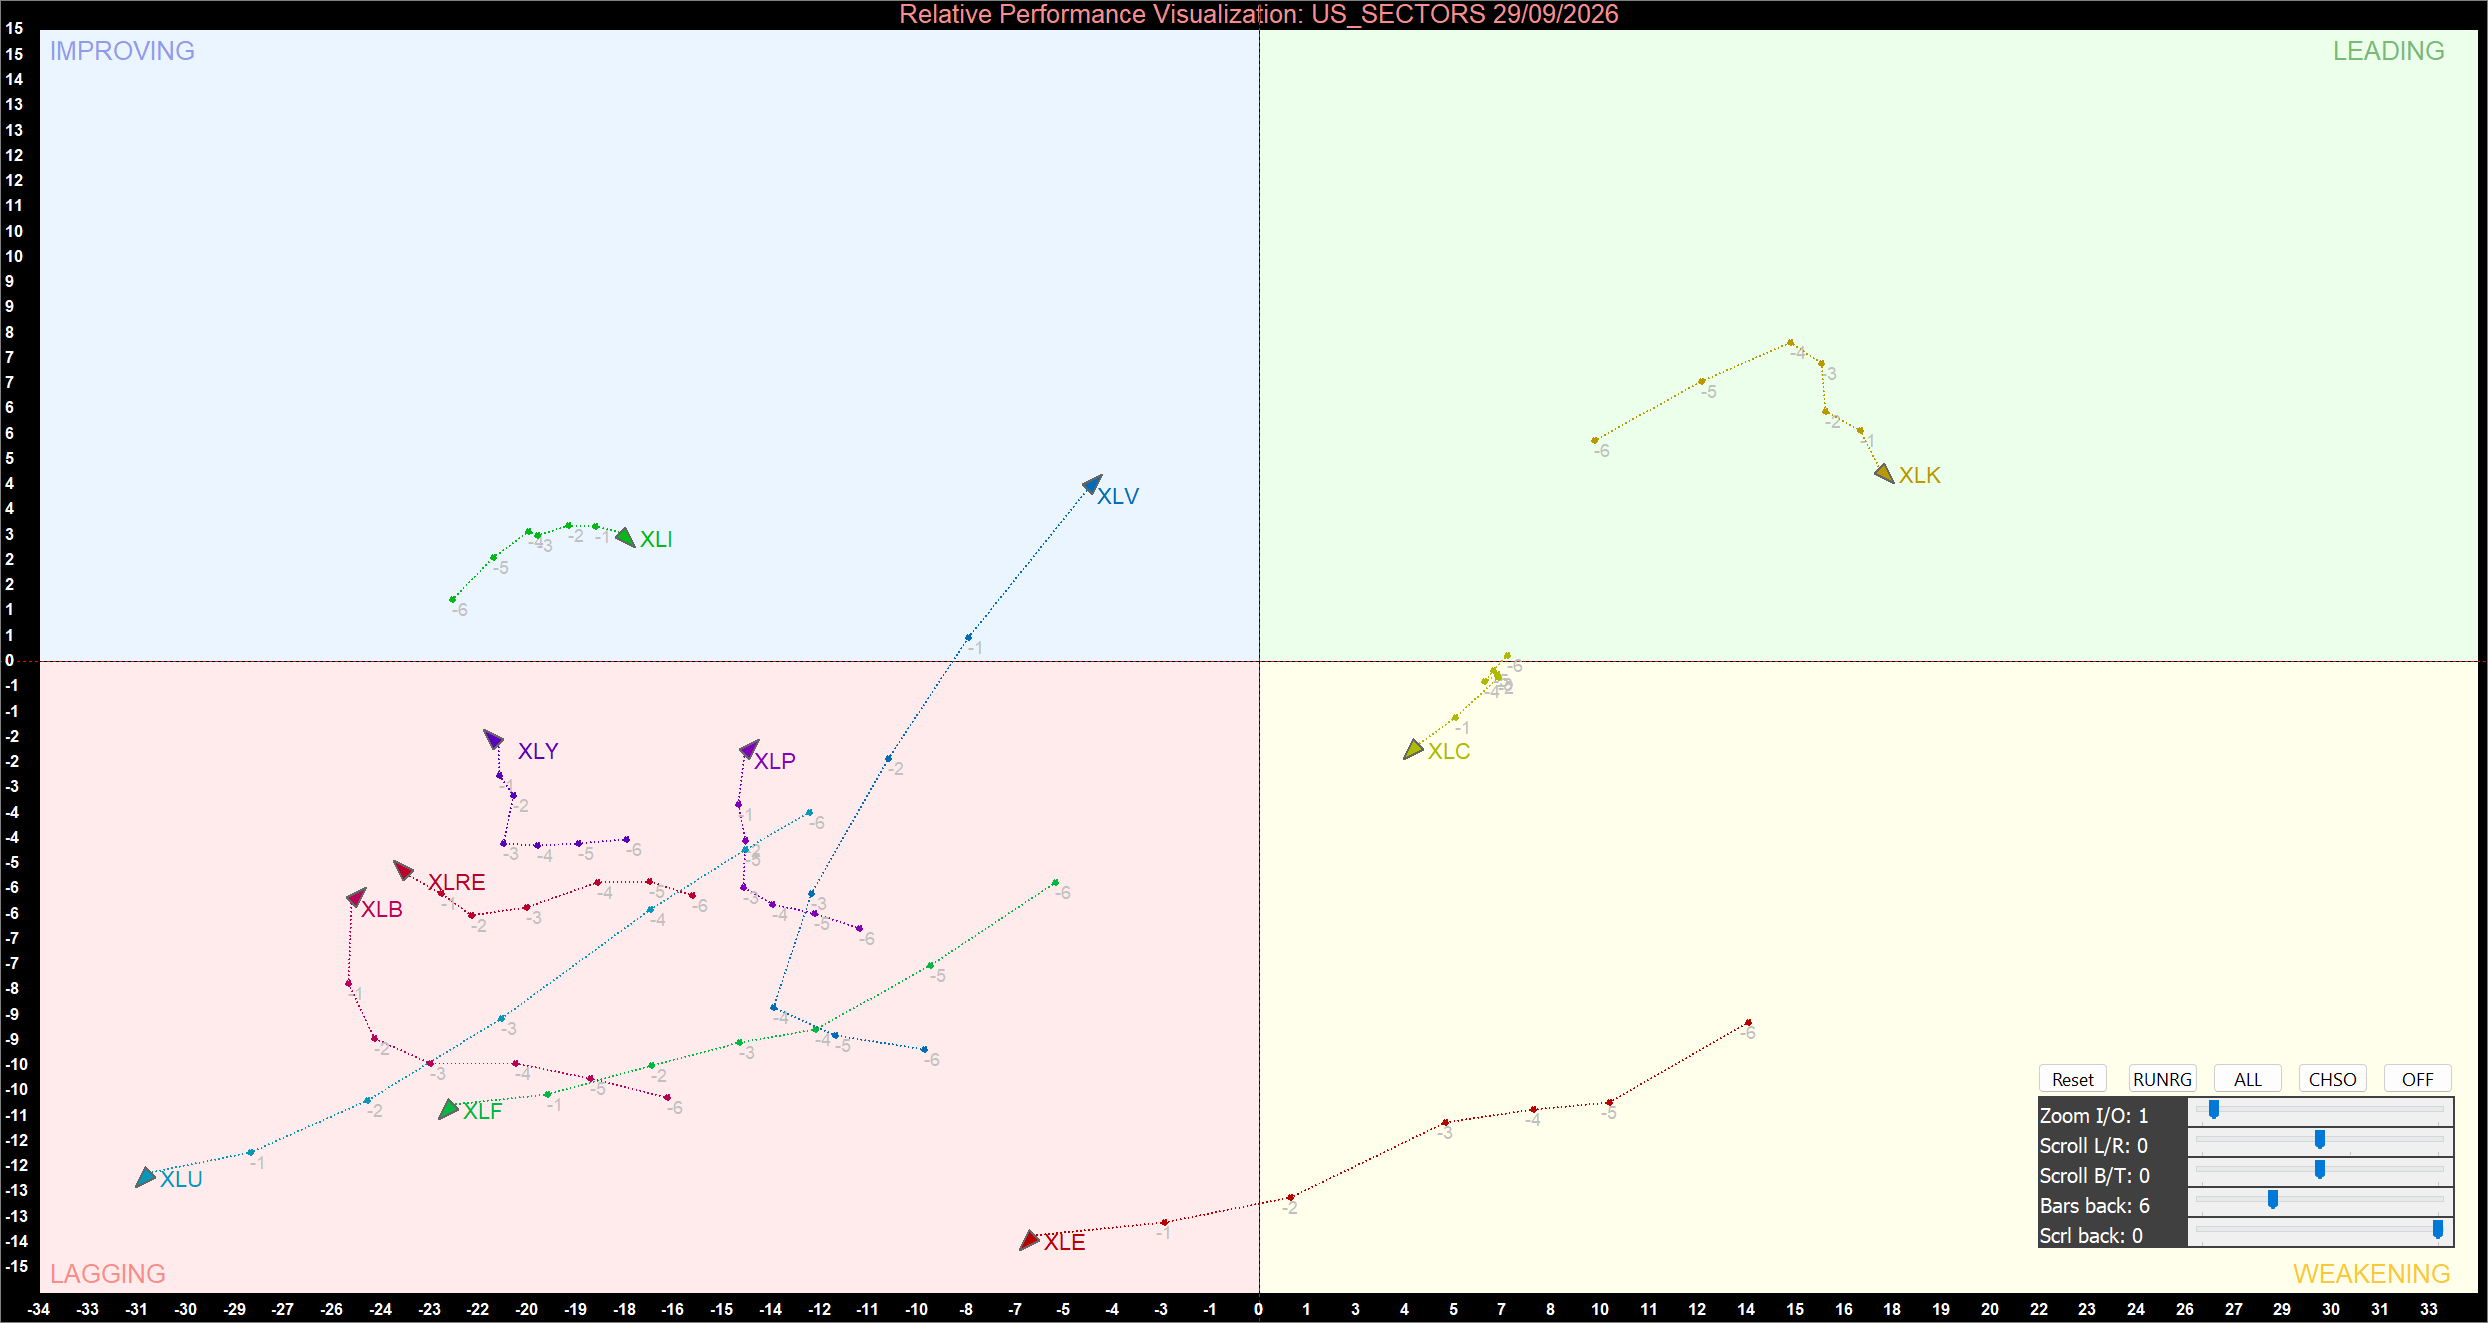
US Sector Relative Momentum Chart at the closing price of 29/09/2026. Powered by: amibroker.com.
Leading Quadrant
Information Technology (XLK) remains the only sector positioned in the Leading quadrant. Its location in the upper-right portion of the RRG indicates relatively strong momentum and relative strength compared with the broader market.
XLK declined only 0.02% on 29 September, leaving the sector almost unchanged on the day. However, the trajectory shown on the chart continues to point lower after XLK previously reached a considerably stronger position within the quadrant. This suggests that Technology remains relatively strong, but its momentum is showing signs of moderation.
A continued downward movement toward the horizontal or vertical midpoint would indicate further deterioration in relative momentum. Conversely, a renewed upward trajectory would reinforce XLK's Leading position.
Improving Quadrant
Industrials (XLI) and Health Care (XLV) remain positioned in the Improving quadrant. Their locations above the horizontal midpoint but to the left of the vertical axis indicate improving momentum while relative strength remains below the Leading area.
Industrials gained 0.21% on 29 September, recovering modestly after previous weakness. Its position in Improving indicates that the broader relative-momentum structure remains stronger than its recent daily performance alone might suggest.
Health Care declined 0.31% during the session but continues to occupy Improving. The sector's position demonstrates that a negative daily return does not necessarily indicate deteriorating broader momentum. Continued upward movement toward the centre and subsequently toward the right would provide stronger evidence of improving relative strength for both sectors.
Weakening Quadrant
Communication Services (XLC) remains positioned in the Weakening quadrant. The sector sits to the right of the vertical axis but below the horizontal midpoint, indicating that relative strength remains comparatively firm while momentum has weakened.
XLC gained 0.26% on 29 September, making it one of the stronger-performing sectors during the session. However, its position in Weakening indicates that the broader relative-momentum trend has not yet confirmed a transition back toward Improving.
A sustained move above the horizontal midpoint would indicate renewed momentum, while continued movement downward and toward the vertical axis would signal further deterioration.
Lagging Quadrant
Energy (XLE), Consumer Staples (XLP), Consumer Discretionary (XLY), Real Estate (XLRE), Materials (XLB), Utilities (XLU) and Financials (XLF) remain in the Lagging quadrant. This broad group continues to represent the largest concentration of sectors on the RRG.
Utilities recorded the strongest daily performance, gaining 1.17%, but its RRG position remains in Lagging. Consumer Discretionary also gained 0.14%, while Real Estate was almost unchanged at -0.02%. These performances demonstrate that short-term gains or stability have not yet translated into stronger relative momentum.
Materials declined 0.75%, Consumer Staples fell 0.52% and Financials dropped 0.33%. Energy was the weakest sector, declining 0.90%. The downward trajectory of Energy remains notable because it indicates continued weakness in its broader relative position.
A sustained upward movement toward the centre of the RRG would be required before the Lagging sectors could transition into Improving.
Bottom Line
The 29 September 2026 US sector Relative Rotation Graph continues to show a concentrated momentum structure. Technology remains the only sector in Leading, while Industrials and Health Care remain in Improving. Communication Services is positioned in Weakening, while Energy remains in Lagging alongside Consumer Staples, Consumer Discretionary, Real Estate, Materials, Utilities and Financials.
Technology's Leading position remains supported by its relatively strong RRG location, although its trajectory continues to point lower. Industrials and Health Care retain improving positions despite mixed daily performances. Communication Services remains in Weakening despite recording a positive daily return, while Utilities delivered the strongest daily gain without moving out of Lagging.
Overall, the RRG indicates that Technology remains the principal area of relative strength, while Industrials and Health Care continue to show improving momentum. The key developments to monitor are whether XLK can stabilise its downward trajectory, whether XLI and XLV continue moving toward Leading, and whether XLC can recover above the horizontal midpoint. For the Lagging group, sustained upward movement toward the centre of the RRG would provide the clearest evidence of improving relative momentum.

 Oct 30, 2026



 Please wait processing your request...