
 CA
 NZ
 UK
 AU
 IND

 US

 Share
 X (Formerly Twitter)
 Whatsapp
 Facebook
 LinkedIn
 Telegram
 Email This Article
 Copy Link
 Summarize with AI
 Chat GPT
 Perplexity

Key Highlights
- Communication Services Maintains Clear Leadership: XLC remains firmly in Leading and displays the strongest positive momentum trajectory among the eleven sectors.
- Consumer Discretionary Also Occupies Leading: XLY is positioned in the upper-right quadrant, although its momentum is considerably less pronounced than XLC.
- Industrials and Real Estate Sit on the Boundary: XLI and XLRE are positioned close to the Leading–Weakening boundary, indicating fragile or marginal positive momentum rather than decisive leadership.
- Seven Sectors Are Classified as Weakening: XLU, XLF, XLP, XLV and XLB occupy Weakening, alongside borderline XLI and XLRE, reflecting negative momentum readings despite positive relative strength.
- Technology and Energy Remain in Lagging: XLK and XLE continue to occupy negative relative strength and momentum territory, with Energy displaying particularly deep weakness.
- Leadership Remains Narrow: Only two sectors are firmly in Leading, compared with seven in Weakening and two in Lagging, highlighting broad deterioration in relative momentum.
The US sector relative performance chart dated 18 November 2026 shows a narrow Leadership configuration, with two of the eleven sectors positioned in the Leading quadrant, seven in Weakening and two in Lagging. Communication Services (XLC) and Consumer Discretionary (XLY) occupy Leading, indicating positive relative strength and momentum compared with the broader market. However, the strength of their positions differs considerably, with XLC displaying a substantially stronger positive momentum profile.
A notable feature of the latest rotation is the position of Industrials (XLI) and Real Estate (XLRE), both of which sit close to the boundary separating Leading and Weakening. These sectors should be treated as borderline rather than unequivocally Leading, as their latest positions are close to the zero-momentum threshold. Materials (XLB), Utilities (XLU), Financials (XLF), Consumer Staples (XLP) and Health Care (XLV) are also positioned in Weakening. Meanwhile, Energy (XLE) and Information Technology (XLK) remain in Lagging, with Energy showing particularly pronounced negative relative strength.
Momentum Breakdown by Sector
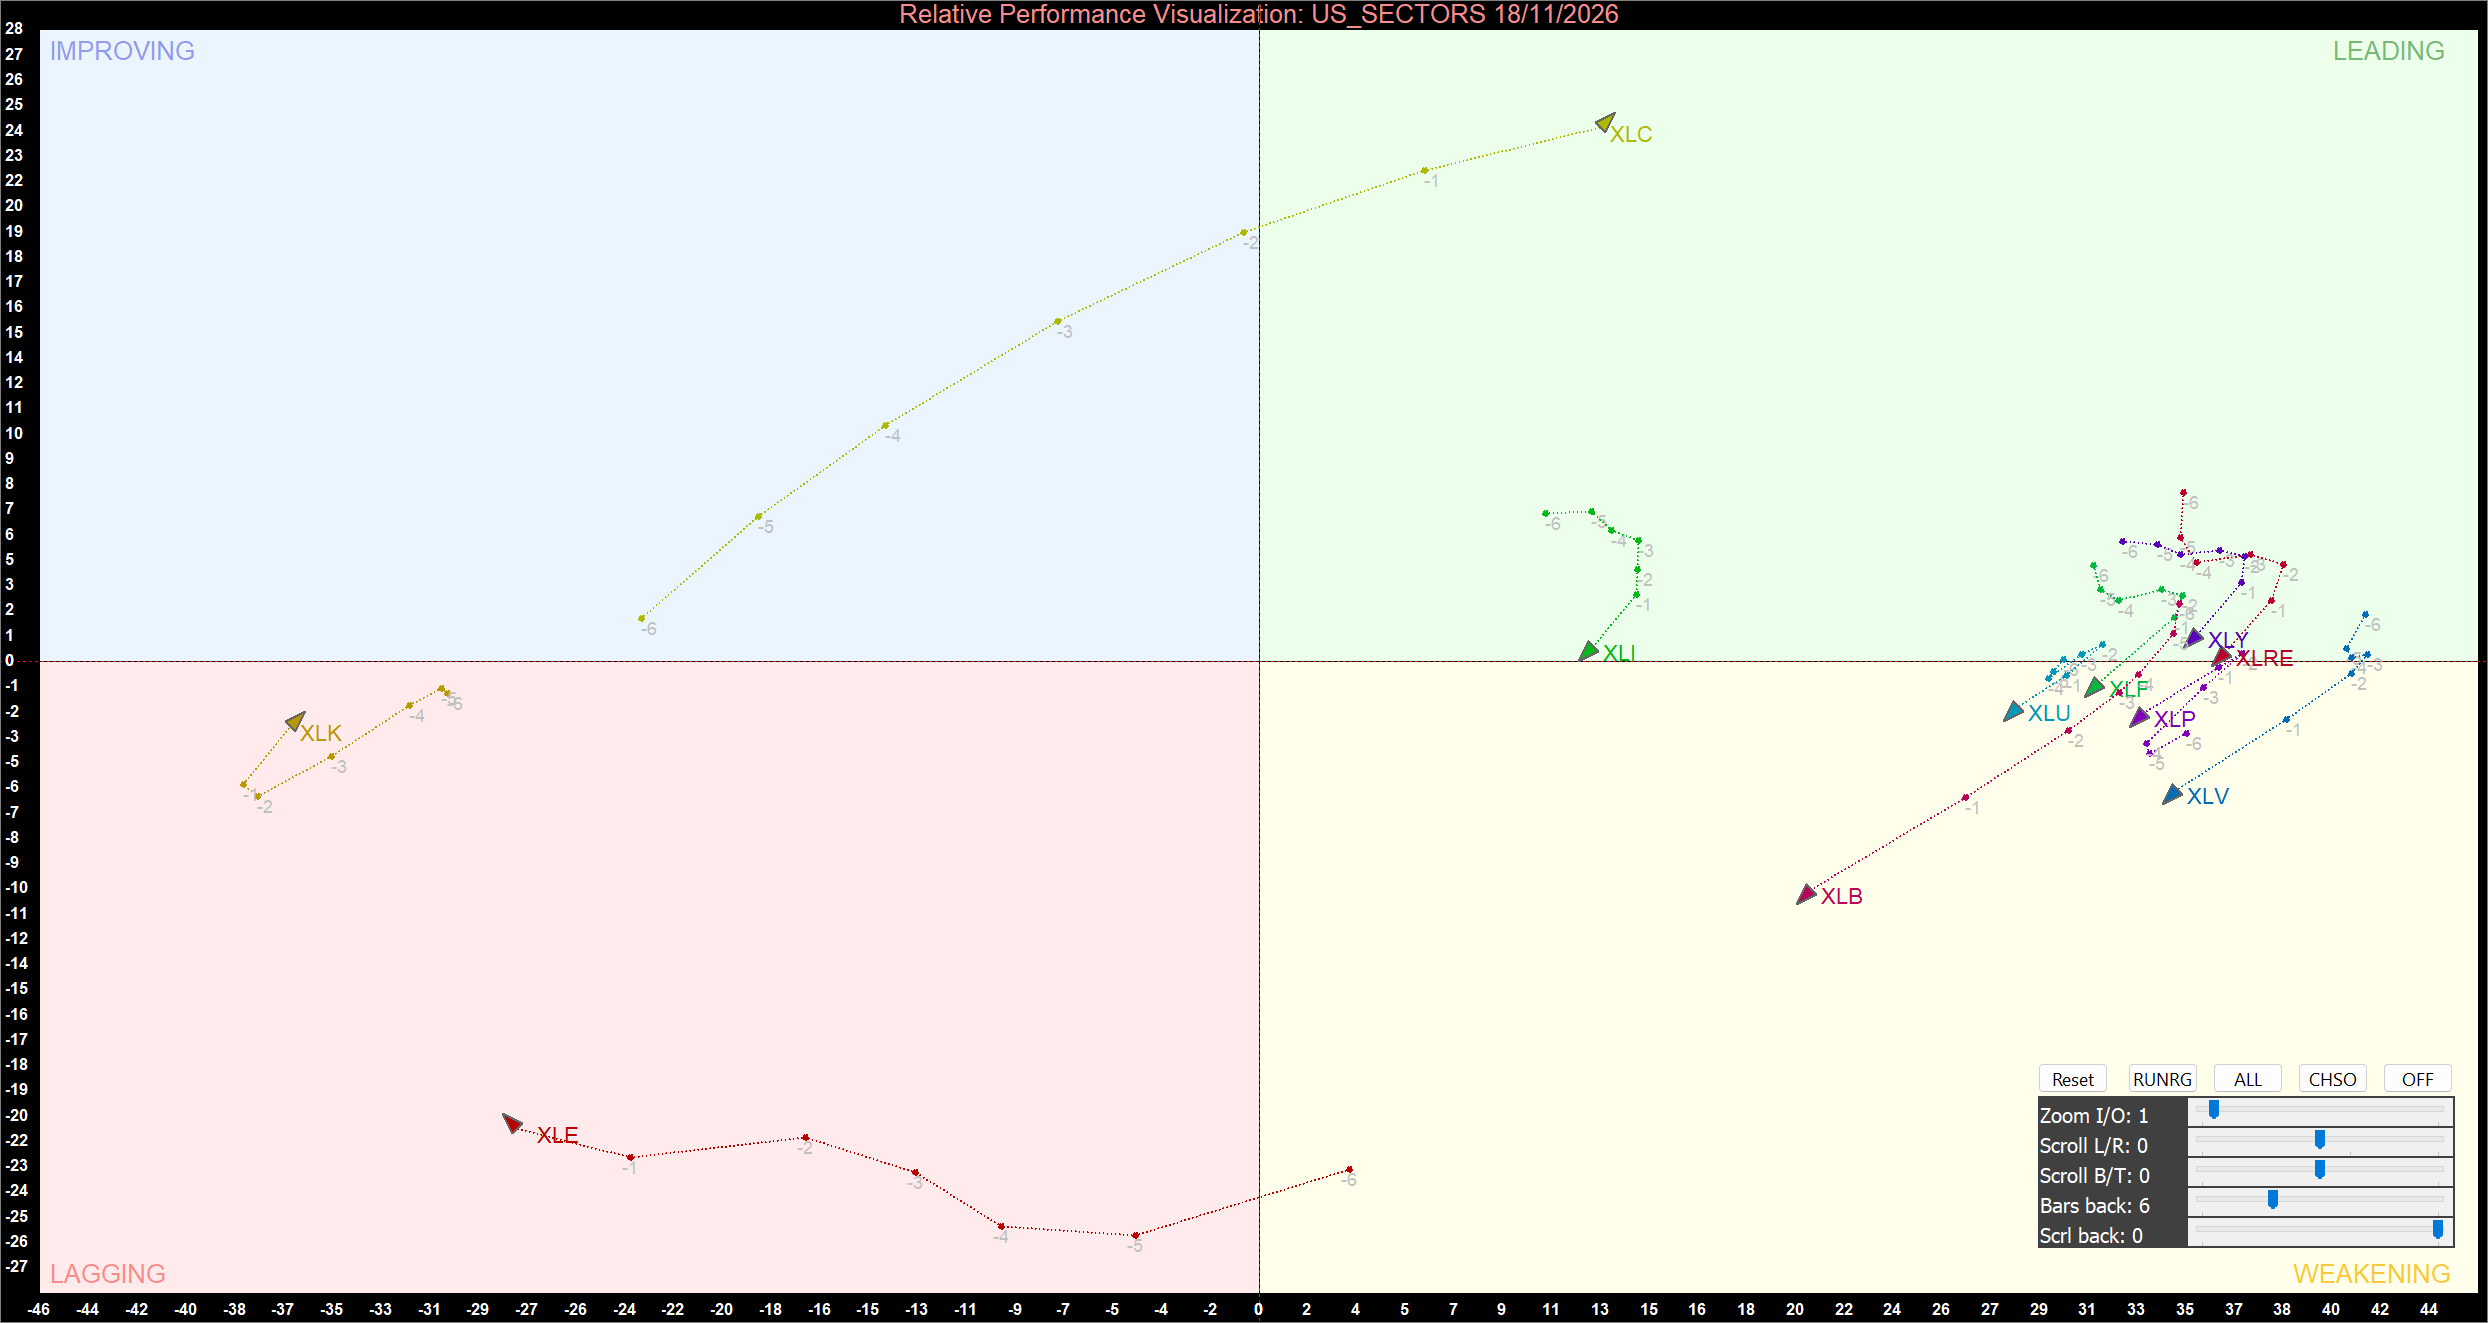
US Sector Relative Momentum Chart at the closing price of 18/11/2026. Powered by: AmiBroker.com.
Leading Sectors Maintain Positive Momentum
Communication Services (XLC) stands out as the strongest sector on the chart, occupying the Leading quadrant with a substantial positive momentum reading. Its historical trail illustrates a pronounced upward and rightward movement from negative relative strength territory into the upper-right quadrant. The latest position remains well above both zero boundaries, indicating that the sector has established a strong relative position and positive momentum compared with the broader market. The steep upward trajectory makes XLC the clearest leader in the current rotation. Sustained strength in this area would reinforce its position, although a flattening or downward turn in the trail would signal a loss of momentum.
Consumer Discretionary (XLY) also occupies Leading, with its latest position above both the relative-strength and momentum boundaries. However, it is clustered much closer to the horizontal zero-momentum line than XLC. This indicates that its positive momentum is comparatively modest and that its leadership is less decisive. The sector would need to move further into the upper-right quadrant to demonstrate a stronger expansion in relative momentum.
Industrials (XLI) and Real Estate (XLRE) are located close to the boundary between Leading and Weakening. Their positions are not sufficiently separated from the zero-momentum threshold to support an unqualified Leading classification. For analytical purposes, both are treated as borderline Weakening. Their proximity to the boundary means relatively small changes in the rotation could shift their classification. A sustained upward movement would support a return to clearer leadership, whereas further downward movement would confirm deterioration in relative momentum.
Weakening Sectors Experience Broad Momentum Deterioration
Materials (XLB), Utilities (XLU), Financials (XLF), Consumer Staples (XLP) and Health Care (XLV) are positioned in the Weakening quadrant. These sectors retain positive relative strength readings but have moved below the horizontal zero-momentum boundary, indicating that their relative momentum is deteriorating. Materials (XLB) is positioned furthest below the horizontal boundary among this group, reflecting a more pronounced negative momentum reading. Healthcare (XLV) is also located noticeably below the threshold, while Utilities, Financials and Consumer Staples are clustered closer to the boundary.
The positions of XLI and XLRE near the Leading–Weakening boundary add to the broad concentration of sectors around or below the zero-momentum line. Although these two sectors retain borderline relative strength, their momentum is not sufficiently positive to establish firm leadership. The overall distribution suggests that positive relative strength is becoming less widespread in terms of momentum. If the trails of the weakening sectors continue moving downward, some could eventually transition into Lagging. Conversely, an upward turn towards and across the horizontal boundary would indicate stabilisation and a potential recovery in relative momentum.
Lagging Sectors Continue to Face Relative Pressure
Energy (XLE) and Information Technology (XLK) remain in the Lagging quadrant, where both relative strength and momentum readings are negative. Energy is particularly weak, occupying a deeply negative position on the chart. Its historical trail shows a substantial deterioration in relative performance, and the latest position remains well below the horizontal and vertical zero boundaries. Although the trail has shown some movement from its most negative readings, XLE has yet to demonstrate a convincing recovery towards positive momentum territory.
Information Technology (XLK) also remains in Lagging, with its latest position reflecting negative relative strength and momentum. Its trajectory remains below both zero boundaries, indicating that the sector has not yet established a meaningful recovery in relative leadership. Compared with XLC, which has advanced strongly into Leading, XLK continues to display a substantially weaker momentum profile. A sustained movement towards the upper-right quadrant would be required before either sector could signal a material improvement. Until then, both remain vulnerable to further relative weakness.
Bottom Line
The US sector momentum configuration on 18 November 2026 is characterised by narrow leadership and widespread deterioration in relative momentum. Communication Services (XLC) is the strongest sector in Leading, while Consumer Discretionary (XLY) also remains in the upper-right quadrant but with more modest momentum. Industrials (XLI) and Real Estate (XLRE) sit close to the Leading–Weakening boundary and are best treated as borderline Weakening rather than firm leaders. Materials, Utilities, Financials, Consumer Staples and Health Care also occupy Weakening, while Energy and Information Technology remain in Lagging. Overall, only two sectors are firmly Leading, compared with seven in Weakening and two in Lagging. The key developments to monitor are whether XLC can sustain its strong trajectory, whether XLY can build stronger momentum, whether XLI and XLRE can reclaim clearer positive momentum, and whether XLE and XLK can move closer to the zero boundaries.


 Nov 19, 2026





 Please wait processing your request...