
Image source: © 2025 Krish Capital Pty.Ltd
Highlights
- TUYA’s Q2FY25 revenue grew 9.3% YoY to USD 80.13 million, driven by PaaS, Smart Solutions, and SaaS growth.
- Net income surged 302.4% YoY to USD 12.59 million in Q2FY25, supported by lower costs and improved margins.
- The board has approved a dividend of USD 0.054 per share/ADS, totaling about USD 33 million.
Tuya Inc. (NYSE: TUYA) provides Internet of Things (IoT) cloud development platforms and services. The company’s board has approved a cash dividend of USD 0.054 per ordinary share/ADS. This is equivalent to an aggregate payout of approximately USD 33 million.
Q2FY25 Financial Performance
TUYA reported revenue of USD 80.13 million in the second quarter of the financial year 2025 (Q2FY25), up 9.3% year-over-year (YoY) from USD 73.28 million. Growth was driven by a 7% rise in PaaS, a 16.7% increase in Smart Solutions, and a 15.6% gain in SaaS & Others.
Net income jumped 302.4% YoY to USD 12.59 million in Q2FY25, supported by lower operating expenses, reduced share-based compensation, and improved segment profitability. Cash and equivalents rose 17.8% YoY to USD 724.07 million despite dividend payments. Operating cash flow increased 53.8% YoY to USD 18.19 million, driven by better operational efficiency and favorable working capital movements.
However, some metrics showed softness. The dollar-based net expansion rate (DBNER) for PaaS declined to 114% from 127%, reflecting slower revenue growth from existing customers. Additionally, non-GAAP net profit slightly decreased by 3.4% to USD 20.1 million compared to USD 20.8 million in the prior-year quarter.
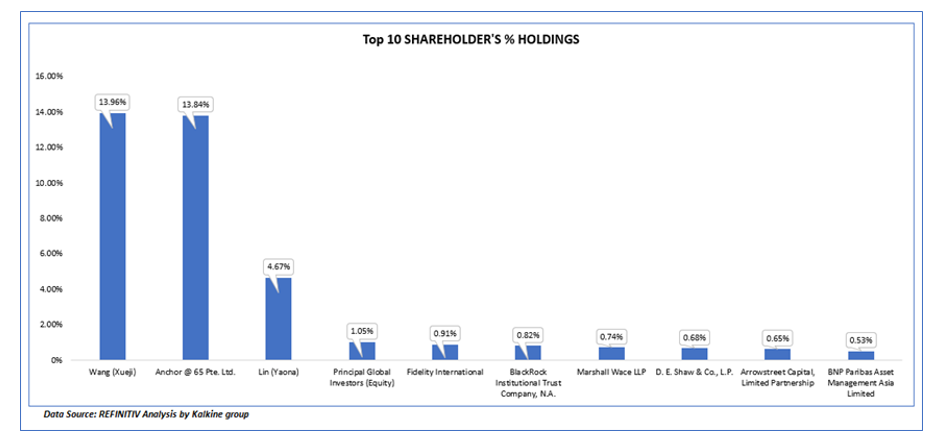
Top 10 Shareholders
The top 10 shareholders of TUYA hold about 37.85% of the total shares in the company. This indicates a concentrated shareholding structure. Wang (Xueji) owns the largest stake at 13.96%. Anchor @ 65 Pte. Ltd. follows closely with a 13.84% holding.
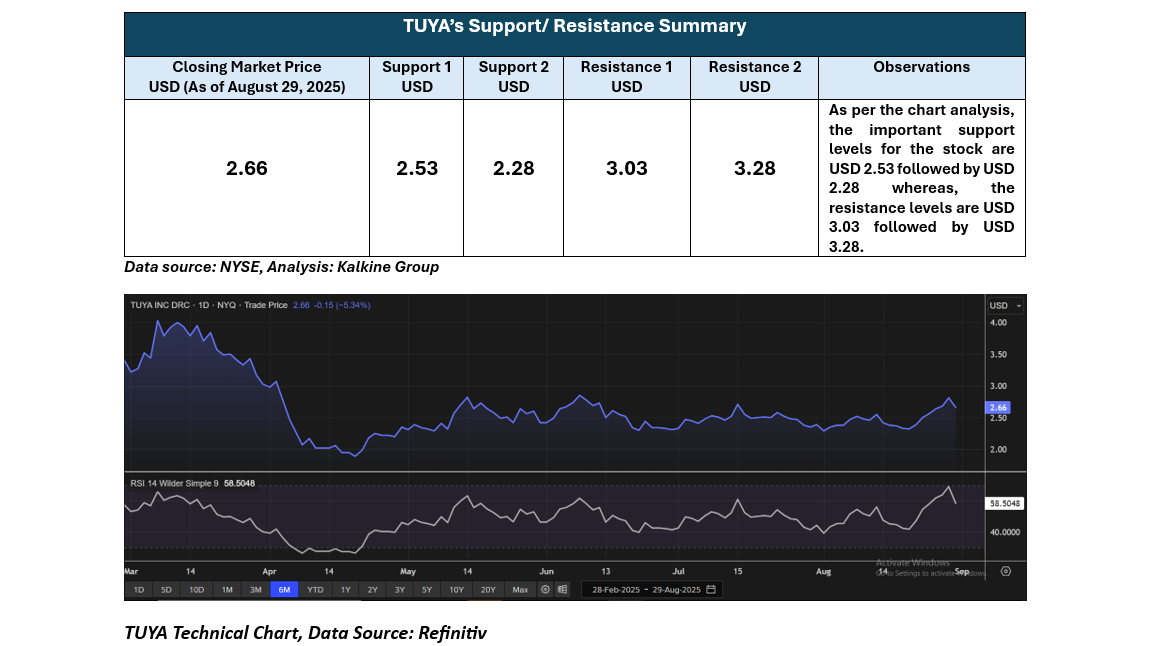
Stock Information
TUYA closed at USD 2.66 on August 29, 2025, down 5.34% intraday. The stock gained 0.76% over the past week and 16.15% over the past month. Three-month and nine-month returns stand at 6.83% and 45.35%, respectively, while the one-year return shows a 79.26% gain. TUYA trades 42.54% below its 52-week high of USD 4.63 (February 21, 2025) and remains well above its 52-week low of USD 1.28 (September 23, 2024).
Note 1: Past performance is not a reliable indicator of future performance.
Note 2: The reference data for all price data, currency, technical indicators, support, and resistance levels is August 29 2025. The reference data in this report has been partly sourced from EODHD/Others.
Technical Indicators Defined
Support: A level at which the stock prices tend to find support if they are falling, and a downtrend may take a pause backed by demand or buying interest. Support 1 refers to the nearby support level for the stock and if the price breaches the level, then Support 2 may act as the crucial support level for the stock.
Resistance: A level at which the stock prices tend to find resistance when they are rising, and an uptrend may take a pause due to profit booking or selling interest. Resistance 1 refers to the nearby resistance level for the stock and if the price surpasses the level, then Resistance 2 may act as the crucial resistance level for the stock.


 Please wait processing your request...