
Highlights
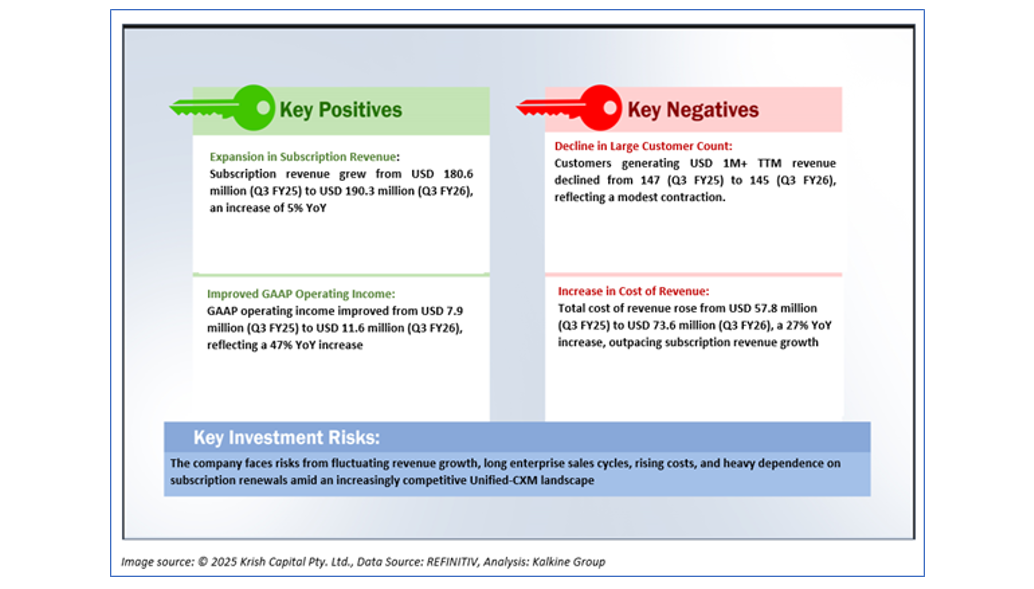
- Sprinklr’s Q3 FY26 revenue rose 9.2% YoY to USD 219.07 mn, supported by subscription and services growth.
- Net income dropped to USD 2.90 mn due to a materially higher tax provision YoY.
- Operating cash flow increased 91.8% YoY to USD 138.53 mn on improved collections and lower receivables.
- Q4 and FY26 guidance indicate steady revenue and operating income expectations across subscription
Sprinklr, Inc. (NYSE:CXM) provides enterprise software for customer-facing functions. Its AI-enabled Unified Customer Experience Management (Unified-CXM) platform supports service, marketing, and other front-office teams by connecting workflows across departments, enabling engagement across digital channels, and using AI insights to manage customer interactions.
Sprinklr’s third quarter of financial year 2026 (Q3 FY26) results showed revenue of USD 219.07 mn, up 9.2% from Q3 FY25, supported by ongoing subscription growth and higher professional services activity tied to broader enterprise adoption of the Unified-CXM platform.
Net income declined to USD 2.90 mn from USD 10.46 mn, reflecting a significant rise in tax provision from USD 2.9 mn to USD 14.4 mn year over year. Cash and cash equivalents for Q3 reached USD 189.59 mn, a 30.5% YoY increase driven by operating cash inflows, reduced accounts receivable, and controlled capital expenditure despite continued share repurchases.
Net cash from operating activities rose to USD 138.53 mn, up 91.8% YoY, supported by improved working-capital movements, stronger collections, lower receivables, and higher non-cash adjustments including stock-based compensation.
Company Outlook
Sprinklr’s outlook for Q4 includes subscription revenue of USD 191–192 mn, total revenue of USD 216.5–217.5 mn, non-GAAP operating income of USD 29–30 mn, and EPS of USD 0.09–0.10. For FY26, the company expects subscription revenue of USD 754–755 mn, total revenue of USD 853–854 mn, non-GAAP operating income of USD 137.5–138.5 mn, and EPS of USD 0.43–0.44.
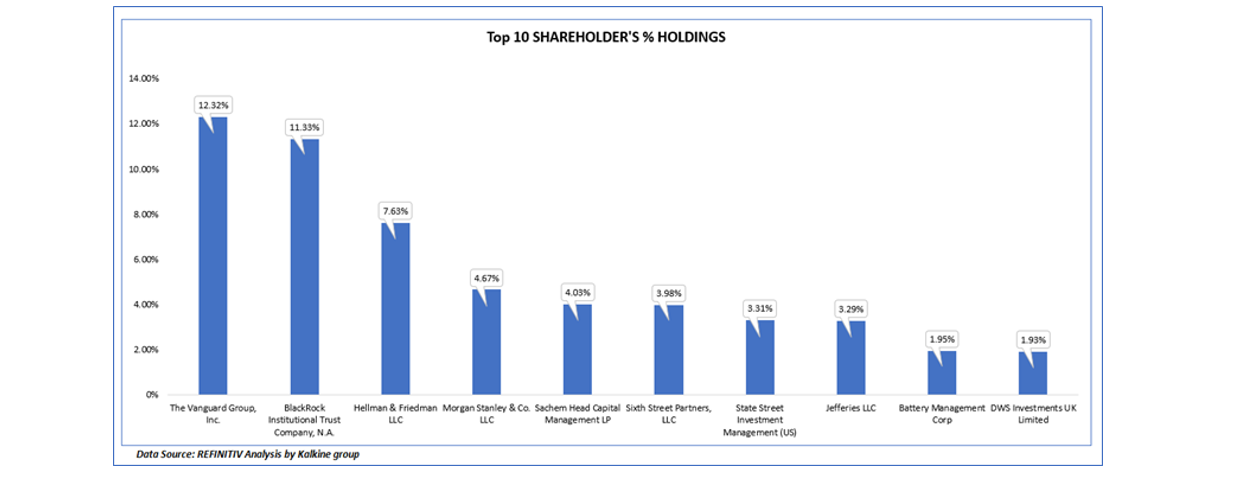
Top 10 Shareholders
The top 10 shareholders collectively hold about 54.43% of the company’s equity, indicating a concentrated ownership structure. The Vanguard Group, Inc. and BlackRock Institutional Trust Company, N.A. are the largest shareholders, with stakes of 12.32% and 11.33%, respectively.
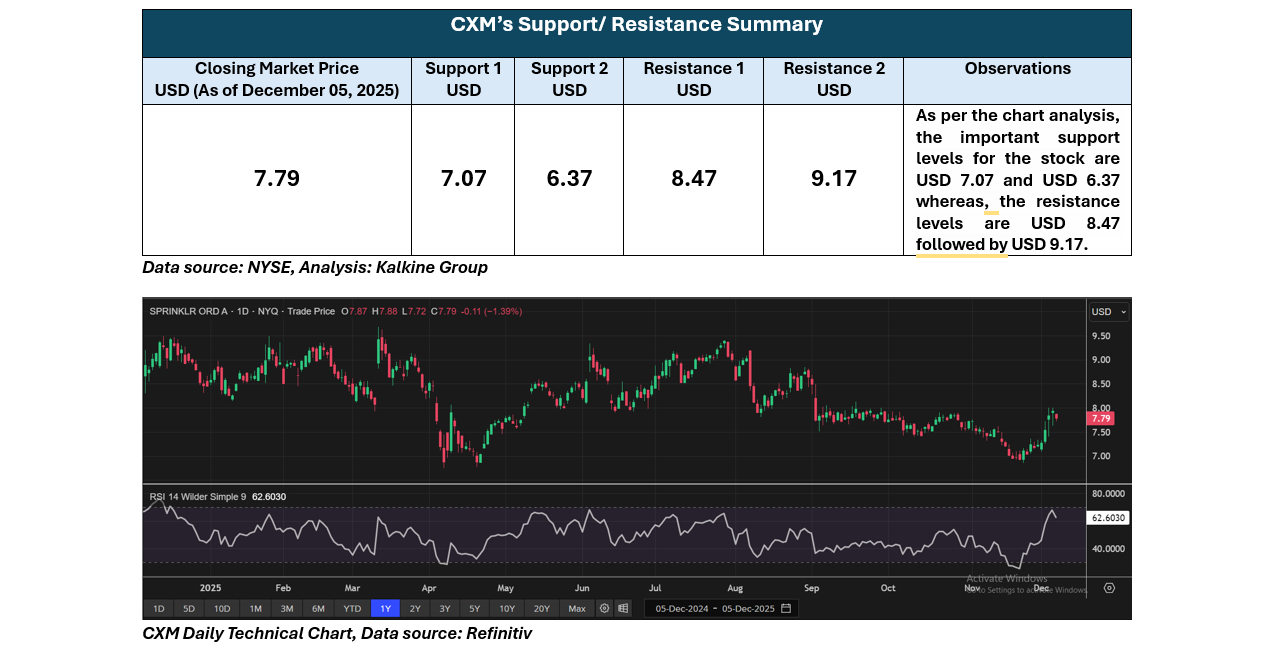
Stock Information
CXM closed at USD 7.79 on December 5, 2025. The stock shows a 3-month return of –1.52% and a 6-month return of –10.46%. CXM traded between a 52-week high of USD 9.69 and a 52-week low of USD 6.75.
Note 1: Past performance is not a reliable indicator of future performance.
Note 2: The reference data for all price data, currency, technical indicators, support, and resistance levels is 05 December 2025. The reference data in this report has been partly sourced from EODHD/Others.
Technical Indicators Defined
Support: A level at which the stock prices tend to find support if they are falling, and a downtrend may take a pause backed by demand or buying interest. Support 1 refers to the nearby support level for the stock and if the price breaches the level, then Support 2 may act as the crucial support level for the stock.
Resistance: A level at which the stock prices tend to find resistance when they are rising, and an uptrend may take a pause due to profit booking or selling interest. Resistance 1 refers to the nearby resistance level for the stock and if the price surpasses the level, then Resistance 2 may act as the crucial resistance level for the stock.


 Please wait processing your request...