
Highlights
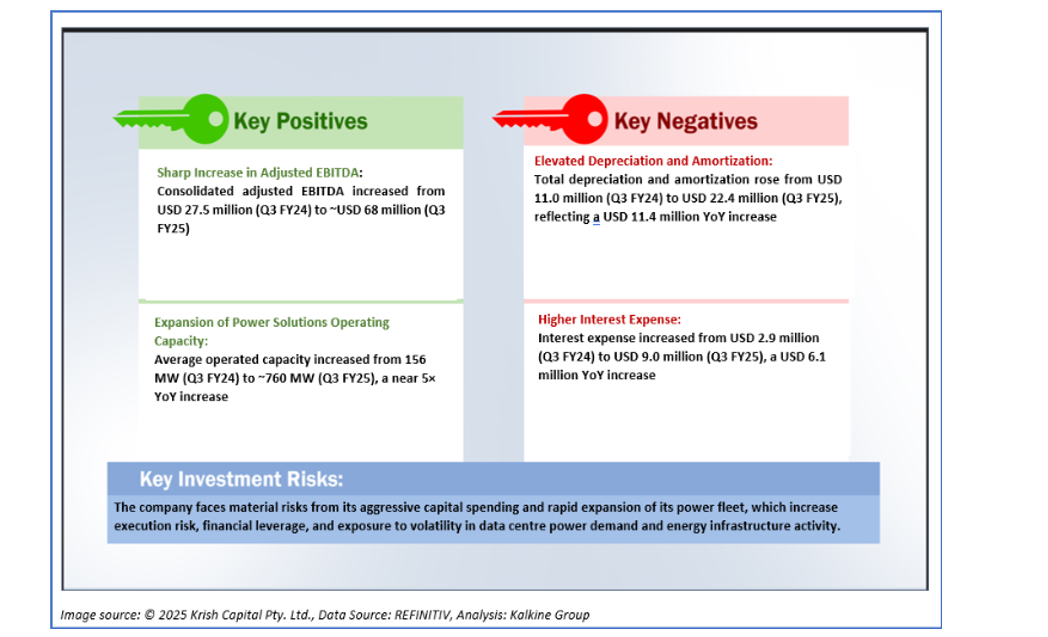
- Solaris Energy’s revenue more than doubled year-over-year in Q3 FY25, driven by turbine leasing growth in the Power Solutions segment.
- Net income surged as operating leverage improved alongside increased service and leasing margins.
- Integration of HVMVLV enhanced SEI’s capabilities in power distribution and broadened its engineering footprint.
- The company raised its Q4 FY25 EBITDA guidance and issued upbeat Q1 FY26 expectations,.
Solaris Energy Infrastructure Inc. (NYSE:SEI) provides portable and scalable, equipment-based solutions designed to support distributed power generation and manage raw materials used in oil and natural gas well completions. The company runs its operations through two main segments: Solaris Power Solutions and Solaris Logistics Solutions.
In the third quarter of financial year 2025, (Q3 FY25), Solaris Energy delivered a notable uplift in performance, with total revenue rising to USD 166.84 million from USD 75.02 million in Q3 FY24, driven largely by the rapid expansion of the Power Solutions segment, where turbine leasing and service revenue increased as deployed MW grew nearly fivefold. Net income improved to USD 24.81 million compared to a loss of USD 2.21 million a year earlier, supported by a higher operating leverage, higher turbine-based leasing margins, and increased consolidated revenue. Cash and cash equivalents stood at USD 106.70 million, slightly lower than USD 114.26 million in the prior-year quarter, reflecting the impact of convertible notes issuance, higher capital spending on turbines, and working-capital requirements tied to increased sales. Net cash provided by operating activities reached USD 113.17 million, up from USD 46.27 million, primarily due to higher revenue and EBITDA contributions from the Power Solutions segment along with continued support from Logistics Solutions.
Recent Business Update
Solaris Energy Infrastructure reported several notable developments in its Q3 results announced on November 3, 2025. The company continued to expand through strategic acquisition and talent enhancement, integrating HVMVLV—a high- and medium-voltage engineering firm—which strengthened its capabilities across power distribution and energy infrastructure. Additional leadership and technical hires further supported Solaris’ rapidly growing commercial pipeline and long-term growth initiatives. Company Outlook
For Q4 FY25, the company has raised its Total Adjusted EBITDA guidance to USD 65–70 million, an upward revision from the earlier range of USD 58–63 million, reflecting expectations of continued operational momentum. Looking ahead to Q1 FY26, Solaris has issued its initial Total Adjusted EBITDA forecast of USD 70–75 million, indicating confidence in sustained growth as the business scales further.
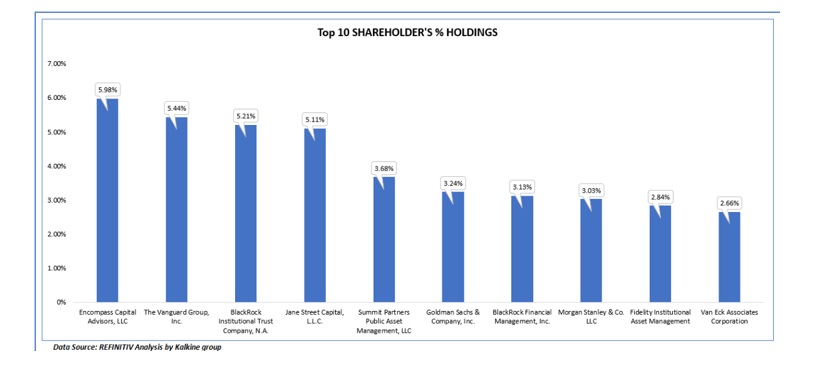
Top Shareholders
The top 10 shareholders collectively hold about 40.33% of the company’s shares, indicating a relatively concentrated ownership structure. Encompass Capital Advisors, LLC and The Vanguard Group, Inc. are the largest investors, with stakes of 5.98% and 5.44%, respectively.
Stock Information
SEI closed at USD 46.07 on December 12. Over the past three months, the stock has delivered a return of 43.07%, while its six-month return stands at 62.91%. SEI’s 52-week high is USD 57.17, recorded on November 3, 2025, while the 52-week low is USD 14.27, touched on April 7, 2025.
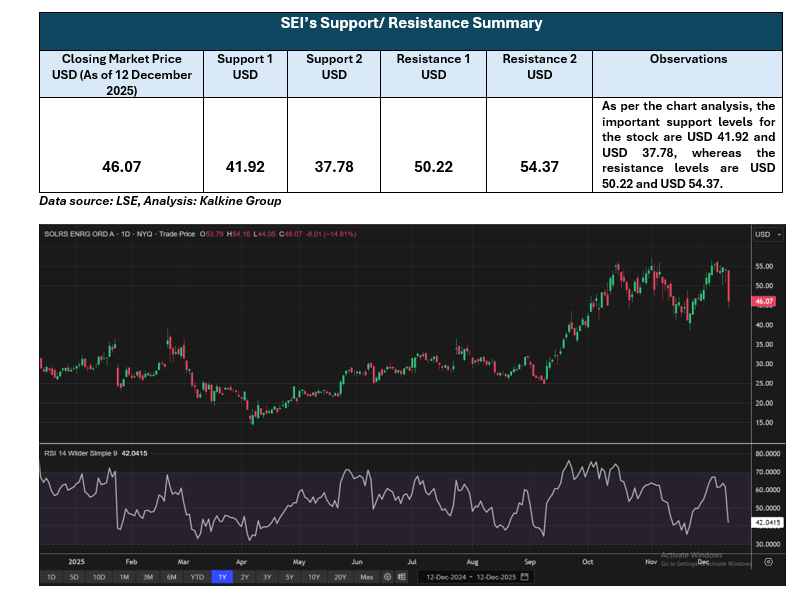
Data source: LSE, Analysis: Kalkine Group
Note 1: Past performance is not a reliable indicator of future performance.
Note 2: The reference date for all price data, currency, technical indicators, support, and resistance levels is December 11, 2025. The reference data in this report has been partly sourced from EODHD/Others.
Technical Indicators Defined: -
Support: A level at which the stock prices tend to find support if they are falling, and a downtrend may take a pause backed by demand or buying interest. Support 1 refers to the nearby support level for the stock and if the price breaches the level, then Support 2 may act as the crucial support level for the stock.
Resistance: A level at which the stock prices tend to find resistance when they are rising, and an uptrend may take a pause due to profit booking or selling interest. Resistance 1 refers to the nearby resistance level for the stock and if the price surpasses the level, then Resistance 2 may act as the crucial resistance level for the stock.


 Please wait processing your request...