
Image source: Shutterstock
Highlights
- SIRI’s total revenue declined by 3.20% in Q2 FY24 due to lower subscriber revenue
- Berkshire Hathaway increased its SIRI stake by 262.25%, becoming the second-largest shareholder
- SIRI forecasts FY24 revenue of USD 8.75 billion, with adjusted EBITDA around USD 2.70 billion
Sirius XM Holdings Inc. (NASDAQ: SIRI) is an audio entertainment company. operating in two segments: Sirius XM and Pandora and Off-platform.
In the second quarter of FY24, the company's total revenue decreased by approximately 3.20%, primarily due to a decline in subscriber revenue. Net profit for the period fell by 1.26%, as a result of reduced revenue, though this was partially offset by lower total operating expenses. Operating cash flows saw a 2.62% increase.
Despite these positive cash flow results, cash and cash equivalents dropped by about 53.70%, mainly due to outflows from investing and financing activities, though this decline was partially offset by higher inflows from operating activities.
Recent Business Update
Recently, the company announced that Berkshire Hathaway has significantly increased its stake in SIRI by 262.25% in the latest quarter. This move has elevated Berkshire Hathaway to the position of the second-largest shareholder, with its ownership rising from 0.04% to 0.14% of the portfolio.
Company Outlook
SiriusXM has confirmed its financial outlook for the full year 2024, projecting total revenue to be approximately USD 8.75 billion. The company also expects adjusted EBITDA to be around USD 2.70 billion and estimates free cash flow to reach USD 1.20 billion.
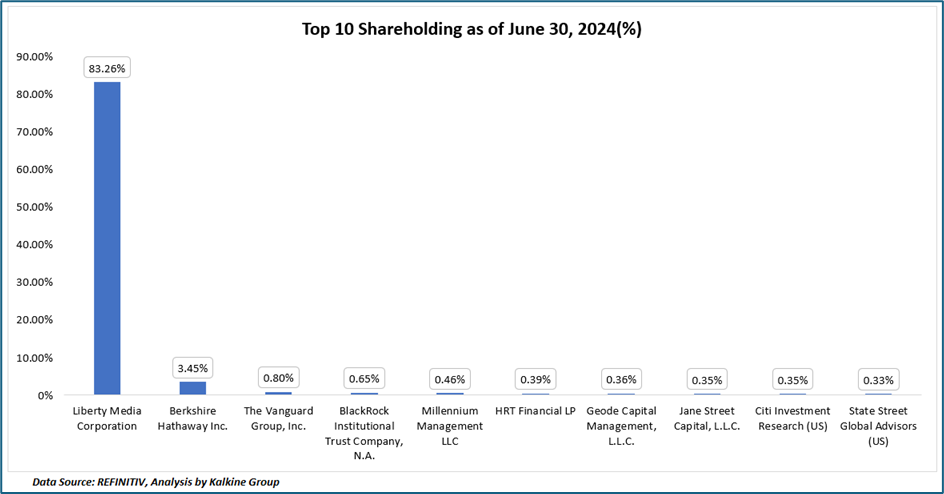
Top 10 Shareholders
The top 10 shareholders of SIRI collectively own approximately 90.41% of the total shares, indicating a concentrated ownership structure. Liberty Media Corporation and Berkshire Hathaway Inc. are the largest shareholders, with stakes of around 83.26% and 3.45%, respectively.
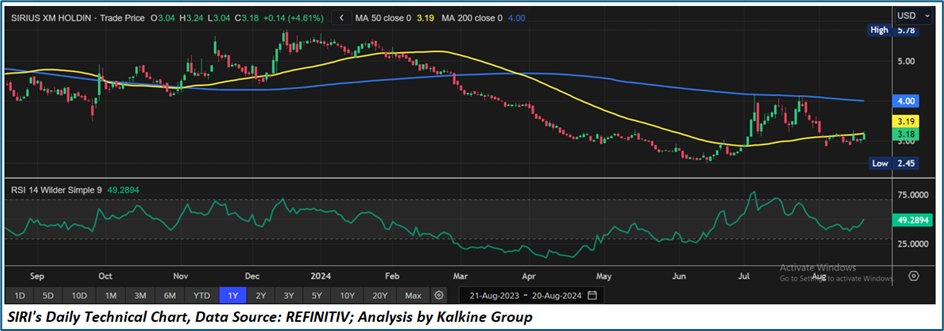
Stock performance
SIRI's stock price has delivered a return of 13.04% over the past three months, although it has experienced a decline of 32.98% over the last nine months. Currently, the stock is trending towards the lower end of its 52-week range, which spans from a high of USD 5.78 to a low of USD 2.45.
Note 1: Past performance is not a reliable indicator of future performance.
Note 2: The reference date for all price data, currency, technical indicators, support, and resistance levels is August 20, 2024. The reference data in this report has been partly sourced from EODHD/Others.

_06_27_2026_21_16_35_168117.jpg)


 Please wait processing your request...