_09_15_2025_14_44_22_292412.jpg)
Image source: © 2025 Krish Capital Pty.Ltd
Highlights
- Total net revenue rose 6.1% YoY to USD 1,765.0 million, driven by higher retail visitation and online gaming.
- Net loss improved to USD 18.3 million from USD 27.1 million in Q2FY24.
- Cash from operations increased to USD 178.2 million, while cash on hand declined to USD 671.6 million.
PENN Entertainment, Inc. (NASDAQ: PENN) offers casino gaming, sports content, and online betting across 28 North American jurisdictions. Its portfolio includes casinos, racetracks, and iCasino operations under brands such as Hollywood Casino, L’Auberge, ESPN BET, and the Score BET. The company operates through five segments: Northeast, South, West, Midwest, and Interactive.
In the second quarter of FY25 (Q2FY25), PENN’s total net revenue was USD 1,765.0 million, up 6.1% from USD 1,663.0 million in Q2FY24. The increase was mainly due to higher visitor numbers and spending at retail properties and higher revenue from online gaming operations. Net loss was USD 18.3 million, compared to USD 27.1 million in the prior year. This change resulted from higher total revenue and lower interest expenses, partly offset by higher operating costs.
Cash from operating activities increased to USD 178.2 million from USD 150.4 million, mainly due to the lower net loss and higher non-cash expenses, partially offset by changes in working capital. Cash and due from banks were USD 671.6 million, down from USD 706.6 million, mainly because of cash used in investing activities, partly offset by inflows from operating and financing activities.
Business Update
Earlier in September, PENN Entertainment announced that the second hotel tower at the M Resort Spa Casino in Henderson, Nevada, is scheduled to open on December 1, ahead of plan. The expansion will increase room capacity and add new guest amenities. The company is also partnering with The Emeril Group to introduce a new restaurant alongside the resort’s existing dining options.
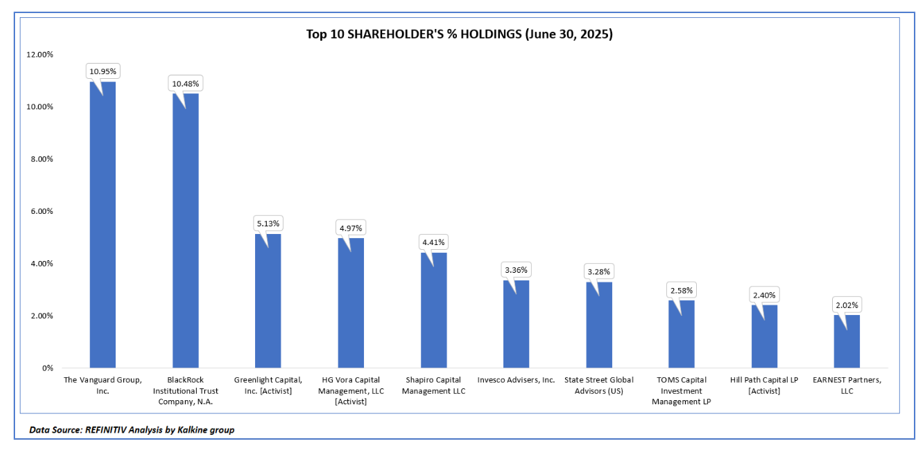
Top 10 Shareholders
The ten largest shareholders of PENN together hold approximately 49.6% of the company’s total shares. Among them, The Vanguard Group, Inc. and BlackRock Institutional Trust Company, N.A. have the largest stakes, at 10.95% and 10.48%, respectively.
Stock Information
As of the closing price of Sep 11, 2025, the stock gained about 21.54% over the past three months and 23.41% over the last six months. It is currently trading within the upper portion of its 52-week price range, which extends from a low of USD 13.25 to a high of USD 23.08.
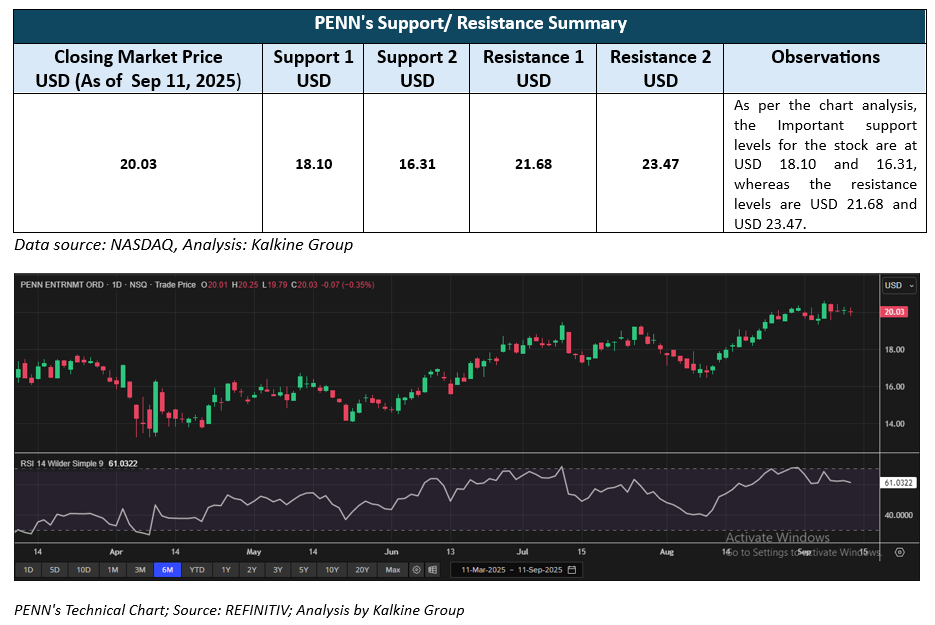
Note 1: Past performance is not a reliable indicator of future performance.
Note 2: The reference data for all price data, currency, technical indicators, support, and resistance levels Is 11 September 2025. The reference data in this report has been partly sourced from EODHD/Others.
Technical Indicators Defined
Support: A level at which the stock prices tend to find support if they are falling, and a downtrend may take a pause backed by demand or buying interest. Support 1 refers to the nearby support level for the stock and if the price breaches the level, then Support 2 may act as the crucial support level for the stock.
Resistance: A level at which the stock prices tend to find resistance when they are rising, and an uptrend may take a pause due to profit booking or selling interest. Resistance 1 refers to the nearby resistance level for the stock and if the price surpasses the level, then Resistance 2 may act as the crucial resistance level for the stock.


 Please wait processing your request...