_04_24_2026_20_17_58_177019.jpg)
Key Highlights
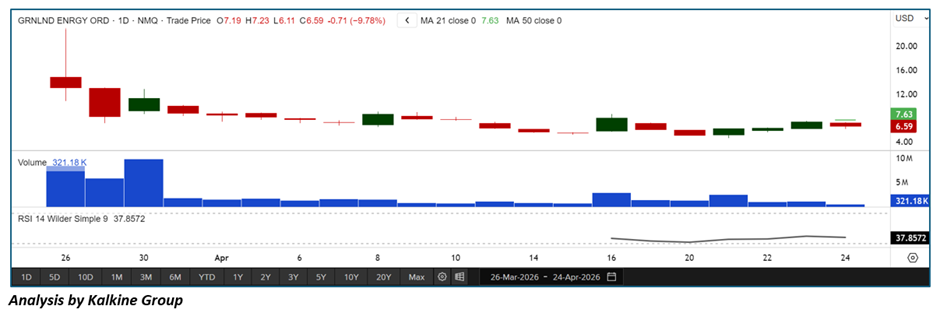
- Greenland Energy is trading below its 21-day (~$7.63) moving average, indicating continued short-term weakness
• Price structure reflects a broader downtrend with lower highs and fading momentum
• Recent candles suggest sideways consolidation after a sharp decline
• RSI near ~37 indicates weak momentum, not yet oversold
• Volume has declined after initial selling pressure, signaling lack of strong buying interest
Trend Structure: Downtrend Remains Intact
Greenland Energy continues to exhibit a weak technical structure following its recent listing and sharp decline.
Key observations include:
• Formation of lower highs since the initial peak
• Significant drawdown post-listing, with stock falling sharply
• No clear reversal pattern emerging
This suggests:
• Sellers remain in control
• Trend direction is still negative
• Current movement is corrective, not bullish
The overall structure reflects continuation rather than recovery.
Price Action: Consolidation After Heavy Selling
Recent price behavior indicates stabilization but not strength:
- Price is moving in a narrow range after steep declines
• Candles are relatively small, showing indecision
• No strong breakout attempts observed
This implies:
• Selling pressure has slowed
• Buyers are not yet aggressive
• Market is forming a weak base
Such price action typically signals:
• Pause before next move
• Risk of further downside if support breaks
Moving Averages: Resistance Still Overhead
The moving average setup confirms bearish pressure:
- Price remains below the 21-day MA (~$7.63)
• Short-term trend remains downward
• Moving averages likely acting as resistance
Interpretation:
• Weak short-term trend
• Lack of bullish confirmation
• Upside attempts may face selling pressure
Unless price reclaims these levels:
• Downtrend is likely to persist
Momentum Indicators: Weak but Not Exhausted
RSI is currently around ~37, indicating subdued momentum.
Key signals:
• RSI below 40 = bearish bias
• Not in oversold territory (<30)
• No bullish divergence visible
Interpretation:
• Selling pressure still present
• Further downside remains possible
• Limited strength for sustained recovery
Volume Analysis: Participation Fading
Volume trends suggest weak conviction:
- High volume during initial sell-off
• Declining volume during consolidation
• No clear accumulation pattern
This indicates:
• Lack of institutional buying
• Weak demand at current levels
• Market waiting for catalyst
Market Structure: Bearish Bias with Base Formation Attempt
The broader structure supports continued caution:
- Downtrend remains dominant
• Price below key resistance levels
• Momentum and volume favor sellers
This combination suggests:
• Ongoing bearish pressure
• Possible base-building phase
• Higher probability of downside continuation
Key Technical Levels & Scenarios
Support Levels
- ~$6.00 (immediate support zone)
• ~$5.00 (near 52-week low region)
• ~$4.50 (major downside support)
Resistance Levels
- ~$7.60 (21-day MA resistance)
• ~$8.50 (recent swing high)
• ~$10.00 (psychological resistance)
Scenarios
- Bearish Continuation (Primary Case)
- Price remains below $7.6 resistance
• RSI stays below 45
• Weak volume persists
• Move toward $6.0–5.0 levels
- Sideways Consolidation (Secondary Case)
- Price holds between $6–7.5 range
• Low volatility environment
• Base formation continues
• Awaiting catalyst
- Bullish Reversal (Low Probability Scenario)
- Price breaks above $7.6–8.5
• Strong volume confirmation
• RSI moves above 50
• Recovery toward $10+
Conclusion: Weak Structure with Limited Recovery Signals
Greenland Energy is currently exhibiting a bearish technical structure following a sharp post-listing decline, with price trading below key moving averages and momentum remaining subdued. While recent consolidation suggests some stabilization, the absence of strong buying interest and continued resistance overhead indicate limited upside potential in the near term.
Unless the stock decisively reclaims key resistance levels with strong volume support, the broader trend remains tilted to the downside, with consolidation likely acting as a pause before the next directional move.


 Please wait processing your request...