_10_23_2025_01_45_41_989860.png)
Highlights
- Digital Realty Trust maintains a consistent quarterly dividend of USD 1.22 per share, yielding ~2.8–2.9%.
- The company’s Q2 FY25 total operating revenues surged 58.4% YoY to USD 2,425.0 million, driven by leasing and asset sales.
- Net income for Q2 jumped over 11-fold to USD 1,032.0 million, supported by higher recurring revenue and capital recycling.
- FY25 Core FFO per share guidance raised to USD 7.15–7.25, with revenue expected at USD 5.93–6.03 billion.
Digital Realty Trust, Inc. (NYSE:DLR) is a real estate investment trust focused on owning, acquiring, developing, and operating data centers through its operating partnership subsidiary, Digital Realty Trust, L.P. The company provides data center, colocation, and interconnection solutions to both domestic and international clients.
Digital Realty maintains a consistent dividend record, currently paying USD 1.22 per share quarterly (annualized USD 4.88), representing a forward yield of approximately 2.8–2.9%. The company has steadily increased dividends over the past decade, reflecting stable cash flows and solid REIT fundamentals. While the estimated payout ratio exceeds 120%, the consistency highlights management’s focus on returning value to shareholders.
Q2 Financial Update
For the second quarter of the financial year 2025 (Q2 FY25), Digital Realty’s total operating revenues, including gains on the sale of investments, rose to USD 2,425.0 million, a 58.4% increase compared with USD 1,530.5 million in Q2 FY24, driven by strong leasing momentum across interconnection and hyperscale segments, along with gains from asset sales.
Net income attributable to DLR reached USD 1,032.0 million, up over 11-fold from USD 80.2 million in the prior-year quarter, reflecting higher recurring revenue, improved operating margins, and substantial gains from capital recycling activities.
Funds from operations (FFO) increased 17.5% year-over-year to USD 600.3 million, supported by record lease commencements, rental escalations, and disciplined cost management that enhanced operational efficiency.
Cash and cash equivalents grew 55.7% YoY to USD 3,554.1 million, strengthened by proceeds from asset dispositions, fund contributions, and strong operating cash flow generation.
Outlook
The company has revised its Core FFO per share guidance for 2025, now projecting USD 7.15–7.25, while constant-currency Core FFO is expected at USD 7.10–7.20.
Total revenue is anticipated to range between USD 5.93–6.03 billion, supported by healthy leasing activity and higher renewal rates. Adjusted EBITDA is expected in the range of USD 3.20–3.30 billion, with cash rental spreads projected at 5–6% and GAAP spreads at 7–8%.
Digital Realty also plans development capital expenditures of USD 3.0–3.5 billion, targeting average stabilized yields above 10%. Funding flexibility will be maintained through approximately USD 2 billion in planned debt issuance at ~4% interest.
The FY2025 outlook emphasizes steady same-capital NOI growth of 3.5–4.5%, potential portfolio occupancy improvements of up to 200 basis points, and robust capital recycling activity in the range of USD 700–1,000 million, underpinning a disciplined growth strategy.
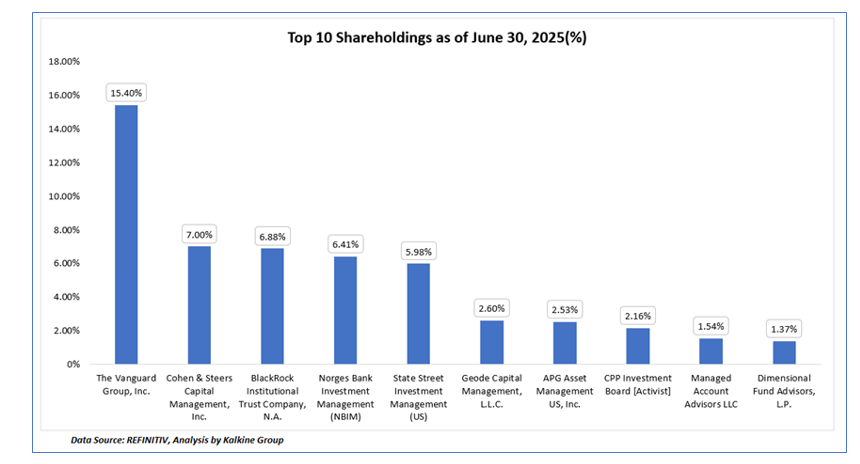
Top 10 Shareholders
The company has a diversified shareholder base, with the top 10 investors collectively holding ~51.85% of total shares. The largest shareholders are The Vanguard Group Inc. (~15.40%) and Cohen & Steers Capital Management, Inc. (~7.00%).
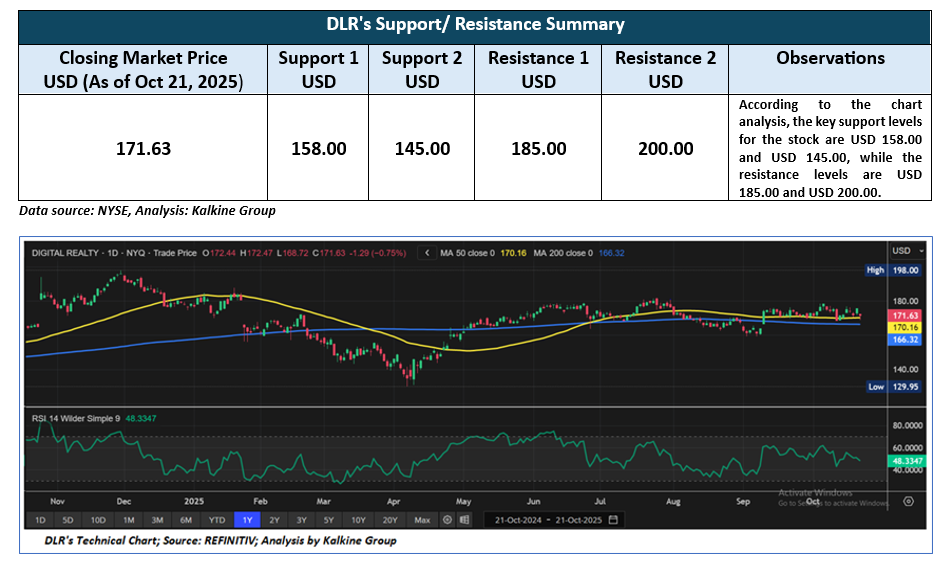
Stock Information
DLR’s share price has corrected approximately 4.29% over the past three months. Over a six-month horizon, the stock has delivered a return of 15.27%. The current trading price is near the upper end of its 52-week range, which spans from USD 129.95 to USD 198.00.
Note 1: Past performance is not a reliable indicator of future performance.
Note 2: The reference data for all price data, currency, technical indicators, support, and resistance levels Is October 21, 2025. The reference data in this report has been partly sourced from EODHD/Others.
Technical Indicators Defined
Support: A level at which the stock prices tend to find support if they are falling, and a downtrend may take a pause backed by demand or buying interest. Support 1 refers to the nearby support level for the stock and if the price breaches the level, then Support 2 may act as the crucial support level for the stock.
Resistance: A level at which the stock prices tend to find resistance when they are rising, and an uptrend may take a pause due to profit booking or selling interest. Resistance 1 refers to the nearby resistance level for the stock and if the price surpasses the level, then Resistance 2 may act as the crucial resistance level for the stock.
_06_12_2026_23_00_13_327450.jpg)


 Please wait processing your request...