
Image source: Pexels.com
Highlights
- CME Group clocked a revenue of USD 1.3 billion and an operating income of USD 820 million in Q3 2023.
- Its net income stood at USD 750 million and diluted earnings per common share was USD 2.06, for the reporting period.
- There has been an average daily volume (ADV) of 22.3 million contracts, with non-U.S. ADV reaching 6.5 million contracts in Q3 2023.
CME Group Inc. (NASDAQ: CME) offers products across diverse asset classes, by trading futures, options, cash and over the counter (OTC) products. CME provides interest rates, equity indexes, foreign exchange (FX), agricultural commodities, energy, and metals.
For Q3 2023, the firm clocked a revenue of USD 1.3 billion and an operating income of USD 820 million. Its net income stood at USD 750 million and diluted earnings per common share was USD 2.06 for the reporting period. On an adjusted basis, the net income was recorded at USD 818 million, while diluted earnings per common share stood at USD 2.25.
This quarter, the company achieved a double-digit growth in adjusted earnings per share for the ninth consecutive quarter. Furthermore, there has been a 6% surge in the group’s interest rate volume. It was mainly because of 18% increase in Treasury futures ADV and significant records in Ultra 10-Year and Ultra T-Bond futures.
There has been an average daily volume (ADV) of 22.3 million contracts, with non-U.S. ADV reaching 6.5 million contracts in Q3 2023. This represents a 7% increase from Q3 2022.
CME’s clearing and transaction fees revenue stood at USD 1.1 billion for the reporting period. Its market data revenue was recorded at USD 168 million for the quarter. The firm had around USD 2.5 billion in cash and USD 3.4 billion in debt, as of 30 September, 2023.
CME paid USD 400 million in the form of dividends for Q3 2023. Total USD 22 billion has been returned to shareholders as dividends since the implementation of the company’s variable dividend policy in early 2012.
Key metrics for FY18-FY22
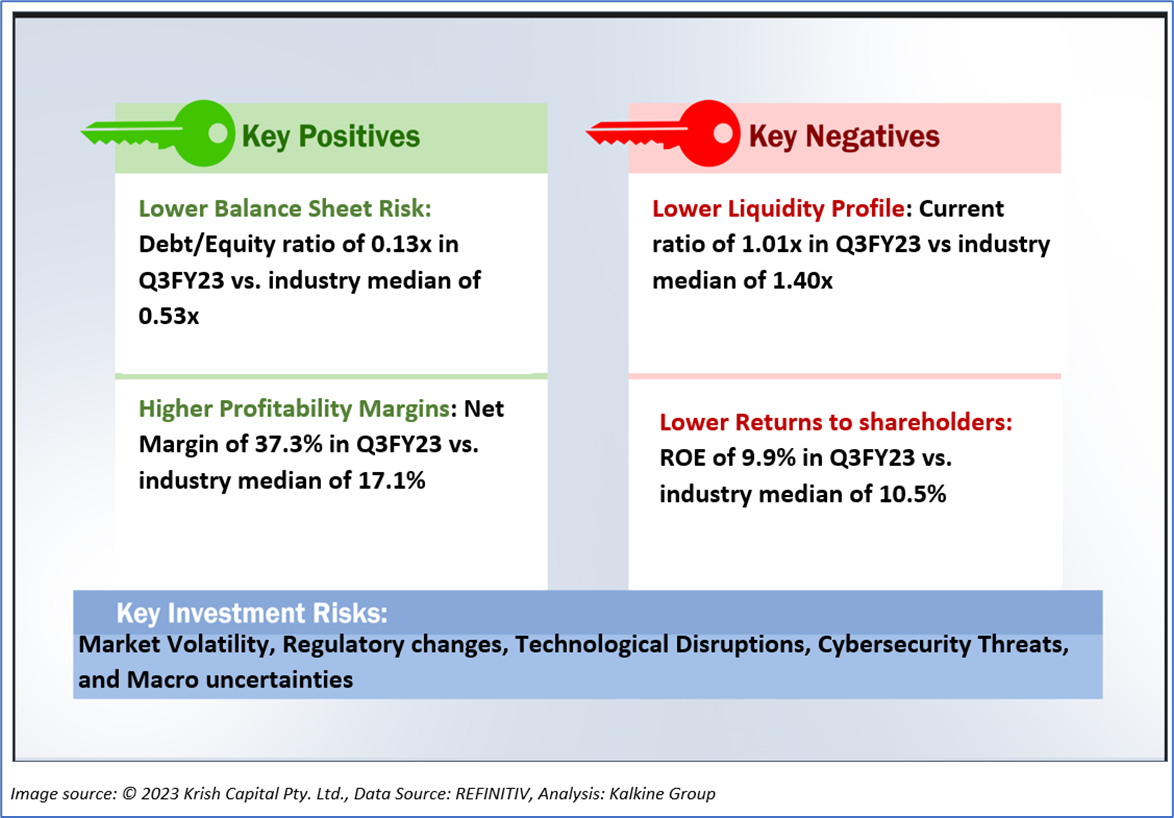
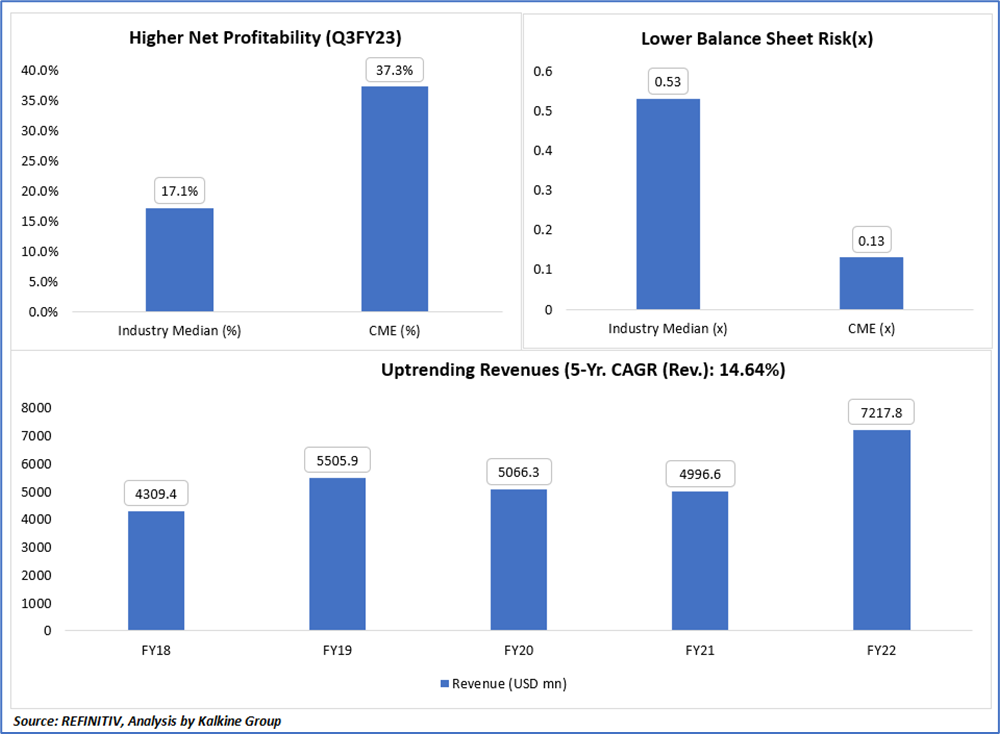
CME’s top-line business grew from USD 4309.4 million in FY18 to USD 7217.8 million in FY22. This marked a compound annual growth rate of around 14.64%. Also, the company posted net margins of 37.3% in Q3FY23, beating the industry median of 17.1%. Notably, CME’s Debt/Equity ratio stood at 0.13x for the third quarter of FY23, against industry median of 0.53x.
Top 10 shareholders
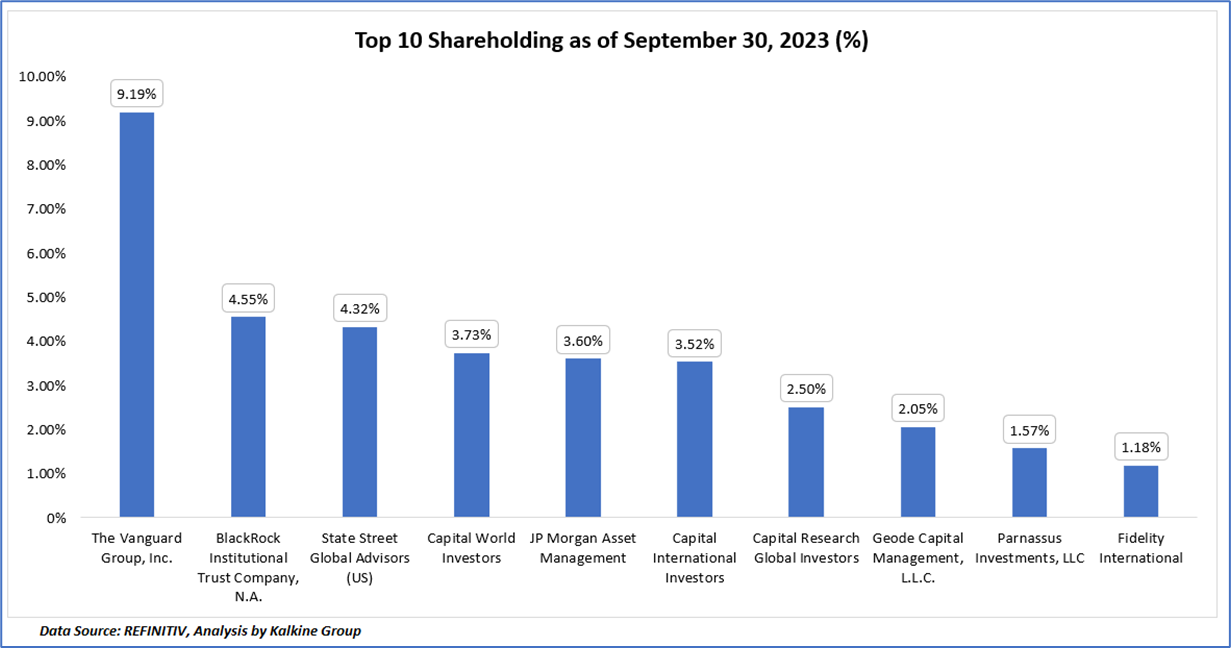
Around 36.21% of the total shareholding is held by its top ten shareholders. While the Vanguard Group, Inc. is the biggest shareholder with 9.19% stake, BlackRock Institutional Trust Company, N.A. is the second biggest shareholder with approximately 4.55% shareholding.
Stock Performance:
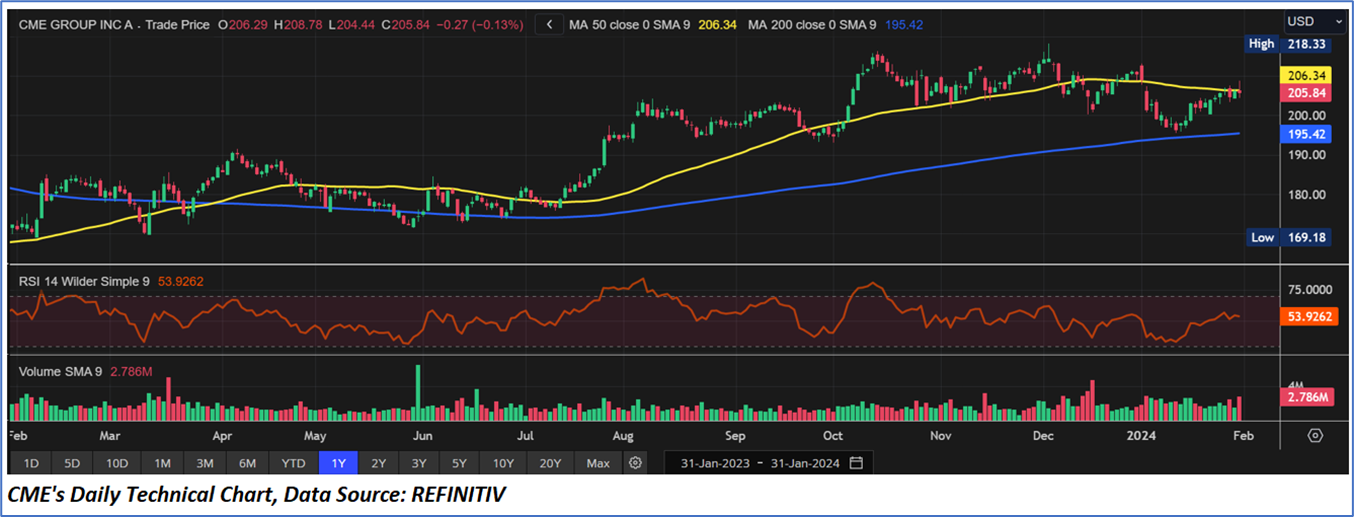
CME stock has returned around 5.67% in the last six months and 16.36% in the last nine months. The stock’s 52-week high and low price stand at USD 223.80 and USD 173.42, respectively.
Note 1: Past performance is not a reliable indicator of future performance.
Note 2: The reference date for all price data, currency, technical indicators, support, and resistance levels is January 31, 2024. The reference data in this report has been partly sourced from EODHD/Others.

_06_27_2026_21_16_35_168117.jpg)


 Please wait processing your request...