
Key Highlights
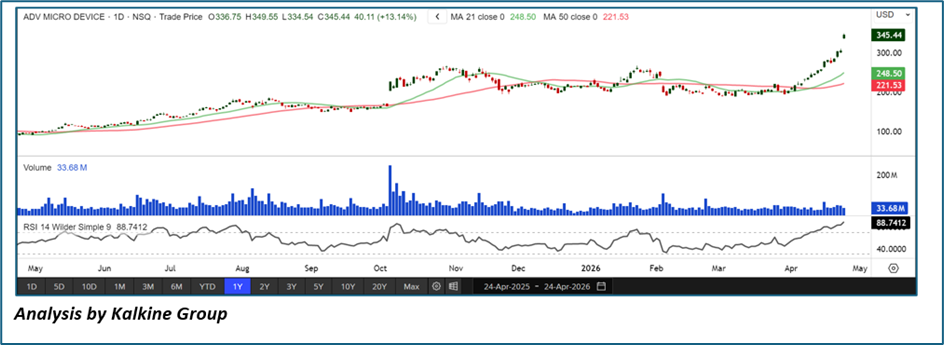
- Advanced Micro Devices Inc. (NASDAQ: AMD) is trading well above its 21-day (~$248.50) and 50-day (~$221.53) moving averages, confirming a strong uptrend
• Price has surged sharply in a near-parabolic move, breaking out of prior consolidation
• RSI near ~88 indicates extremely overbought conditions
• Volume has expanded during the breakout, supporting the rally
• Strong higher high structure with accelerating momentum
Trend Structure: Powerful Uptrend with Acceleration
AMD is in a strong bullish trend that has recently accelerated.
Key observations include:
• Clear pattern of higher highs and higher lows
• Transition from consolidation to sharp upside breakout
• Increasing slope of price movement
This suggests:
• Buyers are aggressively in control
• Trend strength is increasing
• Momentum phase is expanding
The structure reflects a momentum-driven rally rather than a mature trend top—though extension risk is rising.
Price Action: Explosive Rally with Minimal Resistance
Recent price behavior shows strong bullish dominance:
- Large bullish candles with strong closes
• Limited pullbacks during the rally
• Clean breakout above prior resistance
This implies:
• Strong institutional and momentum buying
• Lack of significant supply overhead
• Trend continuation likely in the near term
Such price action typically signals:
• Momentum-driven upside continuation
• Potential for further highs after brief pauses
Moving Averages: Strong Bullish Alignment
The moving average structure reinforces strength:
- Price is far above the 21-day MA (~$248.50)
• Price is well above the 50-day MA (~$221.53)
• Both averages are sloping upward
Interpretation:
• Short-term trend is strongly bullish
• Medium-term trend is bullish
• Moving averages act as dynamic support zones
Any retracement toward these levels could attract dip buyers.
Momentum Indicators: Extremely Overbought Conditions
RSI is currently around ~88, signaling extreme momentum.
Key signals:
• RSI well above 70 = overbought
• Reflects aggressive buying pressure
• Risk of short-term cooling or pullback
Interpretation:
• Trend is very strong
• Short-term consolidation likely
• Momentum remains bullish despite extension
Volume Analysis: Breakout Backed by Participation
Volume trends support the rally:
- Noticeable increase during breakout phase
• Sustained activity during upward move
• No major distribution signals yet
This indicates:
• Strong market participation
• High conviction in the move
• Institutional involvement likely
Market Structure: Bullish Continuation with Extension Risk
The broader structure supports further upside:
- Strong uptrend intact
• Price extended above key averages
• Momentum and volume aligned positively
This combination suggests:
• Continued bullish bias
• Potential for higher highs
• However, elevated risk of short-term pullback
Key Technical Levels & Scenarios
Support Levels
- ~$300 (psychological and recent breakout zone)
• ~$248–250 (21-day MA support)
• ~$220–225 (50-day MA support)
Resistance Levels
- ~$350 (immediate resistance zone)
• ~$370 (next extension target)
• ~$400 (major psychological level)
Scenarios
- Bullish Continuation (Primary Case)
- Price holds above $300
• RSI remains elevated but stable
• Volume stays supportive
• Move toward $350–370 levels
- Healthy Pullback (Secondary Case)
- RSI cools from extreme levels
• Price retraces toward $300–250 zone
• Buyers step in on dips
• Uptrend resumes afterward
- Exhaustion Correction (Low Probability Scenario)
- Sharp rejection from highs
• RSI divergence appears
• Price breaks below $300
• Deeper pullback toward $250
Conclusion: Strong Momentum with Short-Term Cooling Risk
AMD is displaying a powerful bullish breakout with accelerating momentum, supported by strong volume and a well-established uptrend. However, the stock is currently in extremely overbought territory, which increases the likelihood of a near-term pullback or consolidation.
Despite this, the broader trend remains firmly bullish, and any dips toward key support levels could present buying opportunities as long as the overall structure remains intact.


 Please wait processing your request...