
 CA
 NZ
 UK
 AU
 IND

 US

 Share
 X (Formerly Twitter)
 Whatsapp
 Facebook
 LinkedIn
 Telegram
 Email This Article
 Copy Link
 Summarize with AI
 Chat GPT
 Perplexity

Key Highlights
- CENX closed at $66.77, gaining +2.64% in a strong continuation session
• Price traded between $65.72 and $67.82 intraday, reflecting persistent buying interest near highs
• The stock remains firmly above the EMA-21 ($61.02) and EMA-50 ($59.01), confirming a strong bullish trend structure
• RSI-10 closed at 64.80, recovering sharply from recent weakness while remaining below extreme overbought territory
• Volume at 931.35K remained healthy, supporting the latest upside breakout attempt
• CENX has rallied dramatically from sub-$20 levels in mid-2025 to recent highs near $68, delivering a powerful multi-quarter trend advance
• Current price action suggests the recent pullback was corrective consolidation within a dominant uptrend rather than the start of structural weakness
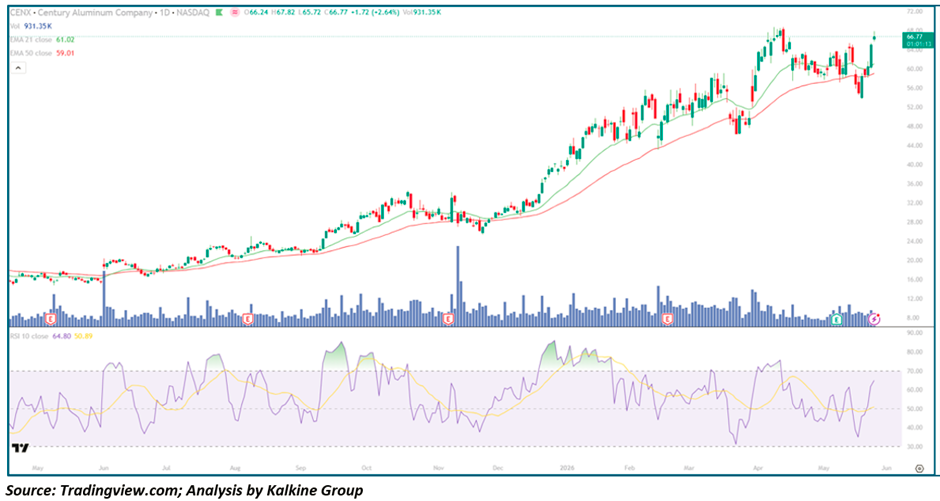
Trend Structure: From Base Formation to Industrial Momentum Leader
Phase 1 — Accumulation & Early Recovery (May – Sep 2025)
Century Aluminum spent much of mid-2025 building a broad accumulation base between the $15–$22 region. During this phase:
- Price action remained relatively stable with gradual higher lows emerging
• EMA-21 and EMA-50 flattened before beginning to curl upward
• Volume remained moderate, indicating quiet institutional accumulation
• Momentum oscillators repeatedly reset without major downside breakdowns
This lengthy consolidation created the foundation for the explosive upside move that followed later in the year.
Phase 2 — Breakout & Trend Expansion (Oct 2025 – Jan 2026)
CENX transitioned from recovery to full bullish trend acceleration during late 2025:
- Price surged from the low-$20 region into the mid-$40s within weeks
• Both moving averages turned sharply higher and established strong bullish alignment
• Breakout candles consistently appeared alongside expanding volume
• RSI frequently entered overbought territory, confirming momentum Leadership
• Higher highs and higher lows became the dominant structural pattern
The speed of the advance suggested aggressive institutional positioning tied to improving industrial metals sentiment and aluminum pricing strength.
Phase 3 — Volatility, Consolidation & Re-Acceleration (Feb – May 2026)
Following the initial rally, CENX entered a more volatile but still constructive phase:
- Multiple pullbacks toward the EMA-21 attracted strong dip-buying interest
• The stock consolidated between roughly $58 and $68 for several weeks
• April’s correction briefly pressured momentum but failed to damage the broader trend
• Recent price action shows a strong rebound from the mid-$50 zone back toward highs near $68
• The latest breakout candle suggests buyers are once again attempting to push toward fresh multi-month highs
Importantly, despite several volatile swings, the stock never lost its broader bullish moving-average structure.
Moving Averages: Bullish Alignment Continues to Strengthen
EMA-21 ($61.02)
- Price remains comfortably above this level following the latest rebound
• The EMA-21 continues rising steadily, confirming strong short-term momentum
• Previous pullbacks toward this average repeatedly triggered renewed upside continuation
• Current positioning above the EMA-21 keeps near-term bulls firmly in control
EMA-50 ($59.01)
- The EMA-50 remains in a powerful upward slope after months of trend expansion
• Acts as the primary medium-term trend support level
• The widening distance between price and EMA-50 reflects strong underlying momentum
• A sustained hold above this level preserves the broader bullish thesis
The clear separation between the rising moving averages reinforces the strength and Maturity of the prevailing uptrend.
Momentum Analysis: RSI Signals Renewed Bullish Strength
RSI-10 at 64.80 shows momentum strengthening again after resetting from prior overbought readings.
Current RSI behaviour indicates:
- Momentum has recovered sharply without yet entering exhaustion territory
• The RSI rebound mirrors the improving price structure following the recent pullback
• Prior RSI resets throughout the uptrend have consistently led to renewed upside continuation
• Current momentum conditions support the possibility of another breakout attempt toward new highs
As long as RSI remains above the neutral 50 zone, bullish momentum remains structurally supportive.
Volume Analysis: Buying Interest Remains Constructive
Volume trends continue to support the bullish narrative for CENX.
Key observations include:
- Stronger volume clusters have consistently appeared during upside breakout attempts
• Pullbacks generally occurred on lighter participation compared to rally phases
• Recent recovery volume near 931K confirms renewed buyer engagement
• No signs of aggressive institutional distribution are currently visible on the chart
The overall volume profile remains consistent with a healthy institutional uptrend rather than speculative exhaustion.
Key Technical Levels
Resistance Levels
- $67–$68 — immediate breakout resistance zone
• $70–$72 — psychological and technical upside target region
• $75+ — potential extension target if breakout momentum accelerates
Support Levels
- $61–$62 — EMA-21 and immediate trend support
• $58–$59 — EMA-50 and key medium-term support
• $54–$55 — prior rebound base and structural support zone
• $48–$50 — major longer-term support from February consolidation
Scenario Analysis
- Bullish Continuation (Primary Case)
If CENX sustains above the EMA-21 near $61:
→ Momentum could continue expanding toward the $70–$72 region
→ A decisive breakout above $68 may trigger trend acceleration
→ Strength in industrial metals and cyclical sectors could attract additional institutional inflows
- Sideways Consolidation (Constructive Outcome)
Price may continue consolidating between $61 and $68:
→ RSI stabilises while momentum resets gradually
→ EMA-21 continues catching up beneath price
→ Extended consolidation would strengthen the foundation for a larger breakout move later
- Bearish Breakdown (Risk Case)
A break below EMA-50 near $59 would weaken the near-term setup:
→ Downside risk could expand toward $54–$55 support
→ Momentum indicators would likely deteriorate sharply
→ However, current trend structure suggests this remains a lower-probability outcome
Conclusion: CENX Continues to Display Strong Industrial Momentum Leadership
Century Aluminum remains one of the stronger industrial and metals trend charts in the market, with price action continuing to respect both major moving averages despite periodic volatility. The stock’s ability to recover quickly from recent weakness and reclaim momentum near highs reinforces the view that buyers remain firmly in control of the broader trend.
The framework moving forward remains clear:
- Above EMA-21 at $61.02 → bullish momentum remains intact
• Above $68 → breakout continuation toward $70–$72 becomes increasingly likely
• Below EMA-50 at $59.01 → caution increases and consolidation risk deepens
For momentum-focused investors and cyclical Commodity traders, CENX continues to exhibit the characteristics of a high-quality institutional uptrend, with current price action suggesting the broader bullish


 Oct 28, 2026





 Please wait processing your request...