
 CA
 NZ
 UK
 AU
 IND

 US

 Share
 X (Formerly Twitter)
 Whatsapp
 Facebook
 LinkedIn
 Telegram
 Email This Article
 Copy Link
 Summarize with AI
 Chat GPT
 Perplexity

Key Takeaways
- Electronic Arts has staged a decisive breakout to fresh all-time highs, reaffirming the strength of its long-term uptrend.
- The stock is trading comfortably above both its 20-day and 50-day exponential moving averages (EMAs), indicating sustained buying momentum.
- Strong trading volumes accompanying the recent rally suggest institutional participation and reinforce the bullish technical outlook.
- Although the Relative Strength Index (RSI) has entered overbought territory, the prevailing trend continues to favor the bulls as long as key support levels remain intact.
Electronic Arts Continues to Strengthen Its Market Position
Electronic Arts Inc. (NASDAQ: EA) is a global leader in digital interactive entertainment, developing and delivering games, content, and online services for consoles, mobile devices, and personal computers. Over the years, the company has successfully diversified its revenue engine beyond traditional packaged game releases by expanding into recurring live services, digital downloads, and mobile gaming. Key flagship franchises—including EA SPORTS FC, Madden NFL, Apex Legends, and The Sims—provide the company with durable intellectual property and a loyal, global user base.
This diversified business model has enabled Electronic Arts to maintain resilient financial performance while capitalizing on structural shifts toward digital distribution and recurring in-game monetization. The company's strong balance sheet, consistent profitability, and history of capital allocation toward R&D and shareholder returns have made it a favored name among growth and institutional investors alike.
Technical Perspective
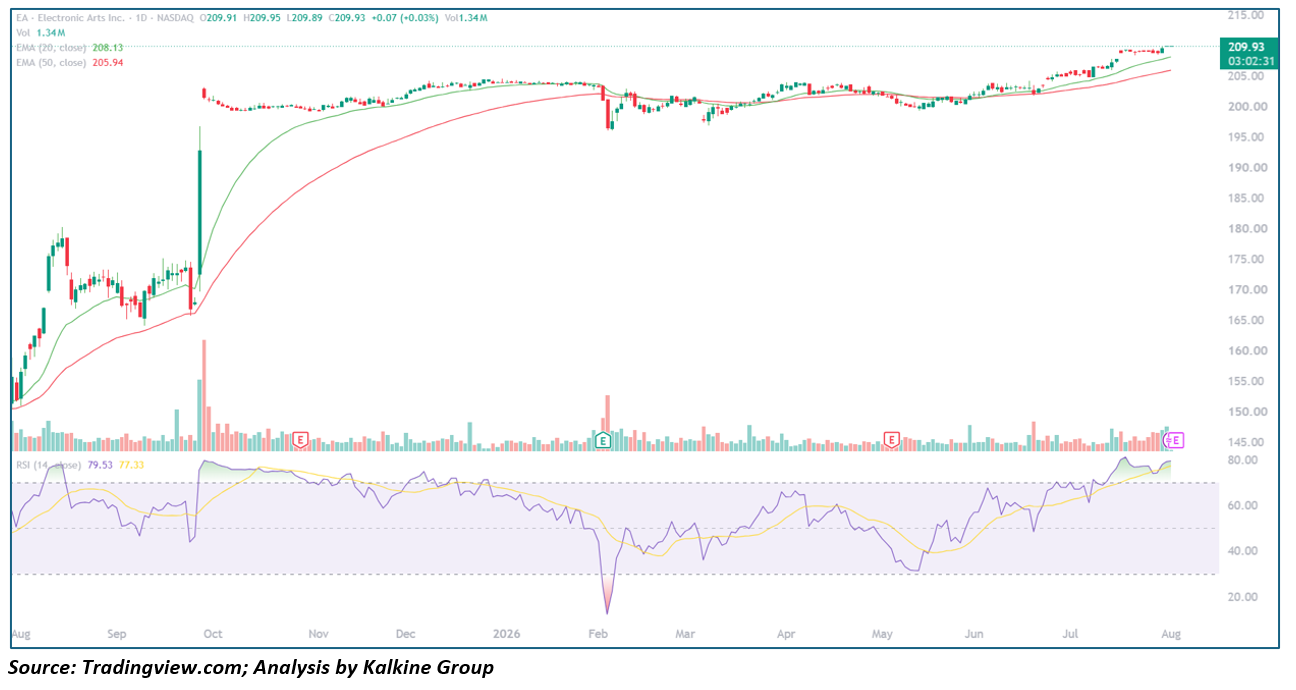
From a technical standpoint, Electronic Arts continues to exhibit one of the strongest chart structures among large-cap interactive entertainment stocks. After spending several months consolidating above the $200 level, the stock delivered a powerful upside breakout supported by a notable increase in trading volume. Such high-volume breakouts often indicate renewed institutional buying interest and typically strengthen the sustainability of an ongoing trend.
The recent rally has propelled EA to fresh record highs near $209.93, confirming that buyers remain firmly in control. More importantly, the price is trading well above both the 20-day EMA (currently near $208.13) and the 50-day EMA (around $205.94). The widening gap between the current market price and these key moving averages reflects accelerating bullish momentum and underscores the strength of the prevailing uptrend.
The moving averages themselves continue to slope upward, providing additional confirmation that the intermediate- and long-term trend remains constructive. Historically, EA has often used its rising 20-day EMA as dynamic support during strong rallies, making this level an important reference point for traders monitoring short-term pullbacks.
The 14-day Relative Strength Index (RSI) has climbed to 79.53, placing the stock in overbought territory. While elevated RSI readings can sometimes precede short-term consolidation or profit-taking, they are also common during powerful bullish trends. In many cases, leading market leaders remain overbought for extended periods as institutional demand continues to push prices higher. Therefore, the current RSI should be viewed as a sign of strong momentum rather than an immediate reversal signal.
Volume analysis further supports the bullish outlook. Recent sessions have seen robust volume (reaching 1.34M shares traded on the current candle), suggesting strong conviction among market participants. Rising prices supported by expanding volume generally indicate healthy accumulation and improve the probability that the breakout will sustain over the medium term.
Key Technical Levels to Watch
Electronic Arts now faces its first psychological hurdle near the $210.00 level, a threshold it is currently testing. A sustained close above this region would reinforce the breakout and could pave the way for an advance toward the $215.00–$225.00 range over the coming weeks.
On the downside, the recent breakout zone near $208.00–$209.00 (aligned with the rising 20-day EMA at $208.13) is expected to act as the first line of support. A successful retest of this zone would further validate the breakout and strengthen investor confidence. Below that, the 50-day EMA around $205.94 represents a key medium-term support level, followed by the major structural base near $200.00, which continues to define the broader uptrend.
As long as the stock remains above these moving averages, the overall technical structure is likely to remain positive.
Growth Drivers Supporting the Technical Trend
Several fundamental factors continue to complement Electronic Arts' bullish technical outlook:
- Live Services & Recurring Revenue: High-margin live services and recurrent in-game purchases continue to provide predictable cash flow and smooth out seasonal release cycles.
- Dominant Sports & Entertainment IP: Flagship titles like EA SPORTS FC and Madden NFL enjoy strong licensing moats and high annual player retention.
- Digital Expansion & Mobile Monetization: Continued growth in direct-to-consumer digital distribution improves operating margins across console, PC, and mobile platforms.
- Strong Financial Health: Reliable free cash flow generation and conservative capital management attract both long-term institutional investors and momentum-focused traders.
Risk Factors
Despite the constructive outlook, investors should remain mindful of potential risks:
- Overbought Technical Indicators: The stock's elevated RSI (79.53) suggests that short-term consolidation or minor profit-taking cannot be ruled out following the recent rally.
- Release Schedules & Execution: Delays or poor reception for key upcoming title releases could temporarily weigh on investor sentiment.
- Market & Industry Competition: Intense competition within the video game and mobile entertainment markets could influence medium-term growth expectations.
- Key Support Breach: A decisive break below the 20-day EMA ($208.13) or sustained weakness beneath the 50-day EMA ($205.94) would be the first indication that bullish momentum is beginning to fade.
Conclusion
Electronic Arts Inc. continues to display an exceptionally strong technical setup, with a decisive breakout to record highs near $210 reinforcing the strength of its long-term uptrend. The stock is trading comfortably above its key moving averages, while robust volume confirms renewed buying interest. Although the RSI has entered overbought territory, the current price action suggests that bullish momentum remains firmly intact. As long as EA holds above its breakout zone and key moving averages, the path of least resistance appears to remain to the upside, with $215.00–$225.00 emerging as the next potential target range over the medium term.


 Nov 06, 2026





 Please wait processing your request...