 CA
 NZ
 UK
 AU
 IND

 US


…
Usinas Siderúrgicas de Minas Gerais S.A. operates in the steel industry and related activities in Brazil and internationally. It operates in two segments, Steel Metallurgy and Mining, and Logistics. The company offers thick plates, hot strips, colled rolled, electrogalvanized, and hot dip galvanized products for the automotive, construction, distribution, energy, oil and gas, and machinery and equipment markets. It is also involved in the extraction and processing of iron ore as pellet feed, sinter feed, and granulated iron ore; steel transformation solutions; operating a distribution center; manufacture and installation of equipment for various industries; and transformation of cold-rolled coils into hot dip galvanized coils. In addition, the company engages in the operation of highway and railway cargo terminals, storage and handling of iron ore and steel products, and road cargo transportation; and rendering of services, rectification of cylinders, and rolling mill rolls. Usinas Siderúrgicas de Minas Gerais S.A. was incorporated in 1956 and is headquartered in Belo Horizonte, Brazil.
Source: TradingView
The charts and visual representations are sourced from TradingView through embedded widgets. For any issues with chart display, please visit the TradingView website
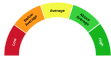
A unique technical analysis driven score developed by Kalkine showing momentum in stock prices based on select technical indicators identified.
Usinas Siderúrgicas de Minas Gerais S.A. (Usiminas) is a Brazilian steelmaker producing flat and long products for automotive, construction and industrial markets. Long-term growth drivers include domestic infrastructure and construction demand, automotive recovery, exports and potential capacity modernisation. Its integrated footprint and established market position could support returns if steel demand recovers.
Principal risks include cyclical demand and margin volatility from commodity and currency swings, competitive pressure, and capital intensity that could constrain cash flow or raise leverage.

Note: The summary and risk score provided above is created by AI and should not be construed as a recommendation of Kalkine.


| Breakdown | 2025-12-31 | 2024-12-31 | 2023-12-31 | 2022-12-31 | 2021-12-31 |
|---|---|---|---|---|---|
| Type | yearly | yearly | yearly | yearly | yearly |
| Date | 2025-12-31 | 2024-12-31 | 2023-12-31 | 2022-12-31 | 2021-12-31 |
| Income before tax | -1451.67M | -95.58M | 1165.83M | 3278.91M | 12336.28M |
| Minority interest | -168.16M | -149.31M | -249.44M | -477.35M | -989.43M |
| Net income | -3017.73M | -145.95M | 1390.93M | 1615.54M | 9070.52M |
| Selling general administrative | 343.32M | 294.36M | 335.20M | 310.34M | 243.63M |
| Selling and marketing expenses | 456.50M | 348.41M | 433.90M | 551.58M | 490.49M |
| Gross profit | 2122.56M | 1659.94M | 1787.83M | 5679.68M | 11274.33M |
| Reconciled depreciation | 1274.79M | 1226.07M | 1061.97M | 902.68M | 982.74M |
| Ebit | 581.61M | 587.12M | 1856.87M | 5237.77M | 11490.46M |
| Ebitda | 1831.36M | 1813.19M | 2918.84M | 6140.45M | 14242.71M |
| Depreciation and amortization | 1249.75M | 1226.07M | 1061.97M | 902.68M | 2752.25M |
| Operating income | 581.61M | 499.58M | 799.44M | 5237.77M | 11490.46M |
| Other operating expenses | 25258.14M | 25370.22M | 26838.91M | 28626.42M | 21960.05M |
| Interest expense | 877.18M | 682.70M | 49.09M | 436.14M | 246.68M |
| Tax provision | 1429.28M | -98.95M | -474.54M | 1186.03M | 2276.32M |
| Interest income | 187.86M | 287.00M | 134.05M | 156.37M | 37.59M |
| Net interest income | -243.21M | -43.30M | 147.91M | 512.45M | 1153.74M |
| Income tax expense | 1401.20M | -98.95M | -474.54M | 1186.03M | 2276.32M |
| Total revenue | 25839.76M | 25869.80M | 27638.35M | 32470.51M | 33736.96M |
| Total operating expenses | 1540.95M | 1160.36M | 988.39M | 1835.59M | -502.58M |
| Cost of revenue | 23717.19M | 24209.86M | 25850.52M | 26790.83M | 22462.64M |
| Total other income expense net | -2033.28M | -595.16M | 366.39M | -1958.85M | 845.82M |
| Net income from continuing ops | -2910.03M | 3.36M | 1640.37M | 2092.89M | 10059.95M |
| Net income applicable to common shares | - | - | - | 1615.54M | 9070.52M |
| Breakdown | 2025-12-31 | 2024-12-31 | 2023-12-31 | 2022-12-31 | 2021-12-31 |
|---|---|---|---|---|---|
| Type | yearly | yearly | yearly | yearly | yearly |
| Date | 2025-12-31 | 2024-12-31 | 2023-12-31 | 2022-12-31 | 2021-12-31 |
| Total assets | 36809.12M | 39871.79M | 40161.75M | 40000.45M | 39481.57M |
| Intangible assets | 2010.17M | 1970.39M | 1962.02M | 1973.51M | 1648.21M |
| Other current assets | 124.53M | 701.16M | 919.82M | 1001.47M | 198.89M |
| Total liab | 13119.64M | 13188.10M | 13612.31M | 14112.70M | 15123.07M |
| Total stockholder equity | 20803.43M | 23881.79M | 23855.65M | 23155.03M | 21749.33M |
| Other current liab | 692.11M | 1135.78M | 1360.81M | 2688.16M | 3875.89M |
| Common stock | 13193.67M | 13200.30M | 13200.30M | 13200.30M | 13200.30M |
| Capital stock | 13200.30M | 13200.30M | 13200.30M | 13200.30M | 13200.30M |
| Retained earnings | 6715.04M | 1607.45M | 9930.58M | 9561.52M | 8324.83M |
| Other liab | - | - | - | 2568.36M | 2610.31M |
| Good will | 2.43M | 2.43M | 2.43M | 2.43M | 2.43M |
| Other assets | - | - | - | 5633.94M | 5607.37M |
| Cash | 5139.04M | 5200.34M | 4655.04M | 2916.05M | 6341.02M |
| Total current liabilities | 4076.47M | 4783.01M | 5514.39M | 5392.63M | 6331.99M |
| Current deferred revenue | 64.86M | 9.03M | 0.00M | - | - |
| Net debt | 1925.67M | 2557.61M | 2945.54M | 3400.69M | 41.08M |
| Short term debt | 777.20M | 1040.51M | 1745.16M | 165.02M | 201.34M |
| Short long term debt | 754.40M | 1014.85M | 1700.10M | 130.97M | 171.83M |
| Short long term debt total | 7064.71M | 7757.95M | 7600.58M | 6316.74M | 6382.10M |
| Other stockholder equity | - | 10681.49M | 10655.35M | 9954.73M | 8549.04M |
| Property plant equipment | - | - | - | 10820.57M | 11085.68M |
| Total current assets | 16792.84M | 17430.92M | 17931.65M | 20358.66M | 19999.47M |
| Net tangible assets | - | - | - | 21179.08M | 20098.69M |
| Short term investments | 1801.07M | 753.64M | 1354.80M | 2156.31M | 682.53M |
| Net receivables | 3802.35M | 3323.79M | 3509.03M | 3547.95M | 5260.79M |
| Long term debt | 6205.85M | 6617.59M | 5793.22M | 6066.58M | 6127.75M |
| Inventory | 5925.85M | 7451.98M | 7492.96M | 9965.17M | 7516.24M |
| Accounts payable | 2542.30M | 2509.79M | 2220.26M | 2539.45M | 2254.76M |
| Accumulated other comprehensive income | 894.72M | 121.55M | 724.78M | - | - |
| Non currrent assets other | 1494.66M | 3754.52M | 7437.65M | 5379.80M | 3307.65M |
| Non current assets total | 20016.28M | 22440.87M | 22230.10M | 19641.79M | 19482.10M |
| Capital lease obligations | 104.46M | 125.52M | 107.26M | 119.18M | 82.52M |
| Breakdown | 2025-12-31 | 2024-12-31 | 2023-12-31 | 2022-12-31 | 2021-12-31 |
|---|---|---|---|---|---|
| Type | yearly | yearly | yearly | yearly | yearly |
| Date | 2025-12-31 | 2024-12-31 | 2023-12-31 | 2022-12-31 | 2021-12-31 |
| Investments | -1048.34M | -900.93M | -3556.39M | -3340.90M | 924.28M |
| Change to liabilities | - | - | - | 97.59M | 712.60M |
| Total cashflows from investing activities | -2118.30M | -900.93M | -2001.27M | -3340.90M | -325.73M |
| Net borrowings | 10.16M | 27.40M | -2.99M | 136.71M | -7.61M |
| Total cash from financing activities | -65.22M | -423.37M | -775.79M | -1088.03M | -1879.96M |
| Change to operating activities | - | - | - | -58.95M | -213.77M |
| Net income | -3017.73M | 3.36M | 1640.37M | 2092.89M | 10059.95M |
| Change in cash | 528.65M | -123.51M | 1738.99M | -3424.97M | 3079.73M |
| Begin period cash flow | 4610.39M | 5323.85M | 2916.05M | 6341.02M | 3261.29M |
| End period cash flow | 5139.04M | 5200.34M | 4655.04M | 2916.05M | 6341.02M |
| Total cash from operating activities | 2282.00M | 989.16M | 4568.08M | 997.12M | 5296.57M |
| Depreciation | 1249.75M | 1226.07M | 1061.97M | 902.68M | 982.74M |
| Other cashflows from investing activities | - | 23.05M | 929.02M | 137.25M | 128.24M |
| Dividends paid | 41.90M | 383.80M | 726.53M | -1233.22M | -1849.26M |
| Change to inventory | 1475.78M | 201.72M | 2271.35M | -2496.57M | -3556.34M |
| Change to account receivables | 303.45M | 364.56M | 359.20M | 473.08M | -1116.02M |
| Other cashflows from financing activities | -33.48M | -66.97M | -46.26M | 2152.22M | -23.09M |
| Change to netincome | - | - | - | 1371.21M | -1276.30M |
| Capital expenditures | 1029.69M | 995.16M | 2984.18M | 2091.88M | 1483.29M |
| Change in working capital | 692.26M | -354.52M | 3586.52M | -2522.48M | -3492.38M |
| Stock based compensation | - | - | 709.98M | - | - |
| Other non cash items | 2098.68M | 114.26M | -1720.79M | 524.03M | -2253.75M |
| Free cash flow | 1252.31M | -6.00M | 1583.90M | -1094.76M | 3813.28M |
Sector: Basic Materials Industry: Steel
|
Stock Name
|
Change
(USD) |
Price
(USD) |
Trailing
PE (x) |
Forward
PE (x) |
Price Sales
TTM (x) |
Price to Book Value (x)
|
Enterprise Value
to Revenue (x) |
Enterprise Value
to EBITDA (x) |
|---|---|---|---|---|---|---|---|---|
| USNZY Usinas Siderurgicas de Minas Gerais |
-0.01 1.11% |
0.89 | - | 10.34 | 0.07 | 0.43 | 0.32 | 7.93 |
| MT ArcelorMittal SA ADR |
-1.50 2.33% |
62.79 | 30.54 | 11.44 | 0.88 | 1.00 | 1.02 | 10.02 |
| NUE Nucor Corp |
-9.02 3.46% |
251.73 | 9.01 | 14.84 | 1.21 | 2.11 | 1.21 | 5.42 |
| AMSYF ArcelorMittal SA |
-1.81 2.80% |
62.77 | 11.82 | 12.18 | 0.64 | 0.68 | 0.90 | 7.76 |
| NPSCY Nippon Steel Corp ADR |
-0.02 0.35% |
4.41 | 222.00 | 7.94 | 0.00 | 0.63 | 0.85 | 10.07 |
Usinas Siderúrgicas de Minas Gerais S.A. operates in the steel industry and related activities in Brazil and internationally. It operates in two segments, Steel Metallurgy and Mining, and Logistics. The company offers thick plates, hot strips, colled rolled, electrogalvanized, and hot dip galvanized products for the automotive, construction, distribution, energy, oil and gas, and machinery and equipment markets. It is also involved in the extraction and processing of iron ore as pellet feed, sinter feed, and granulated iron ore; steel transformation solutions; operating a distribution center; manufacture and installation of equipment for various industries; and transformation of cold-rolled coils into hot dip galvanized coils. In addition, the company engages in the operation of highway and railway cargo terminals, storage and handling of iron ore and steel products, and road cargo transportation; and rendering of services, rectification of cylinders, and rolling mill rolls. Usinas Siderúrgicas de Minas Gerais S.A. was incorporated in 1956 and is headquartered in Belo Horizonte, Brazil.

Av. do Contorno, 6594, Belo Horizonte, MG, Brazil, 30110-044

55 31 3499 8856
| Name | Title | Year Born |
|---|---|---|
| Mr. Alberto Akikazu Ono | CEO & Member of Exec. Board | NA |
| Mr. Thiago da Fonseca Rodrigues | CFO, IRO, VP of Fin. & Investor Relations Officer and Member of Exec. Board | NA |
| Mr. Miguel Angel Homes Camejo | VP of Commercial Area & Member of Exec. Board | NA |
| Mr. Americo Ferreira Neto | VP of Industrial Area & Member of Exec. Board | NA |
| Mr. Toshihiro Miyakoshi | VP of Technology & Quality and Member of Exec. Board | NA |
| Mr. Gino Eugenio Ritagliati | VP of Corp. Planning Officer & Member of Exec. Board | NA |
| Mr. Carlos Hector Rezzonico | Chief Exec. Officer of Mineração Usiminas | 1953 |
| Julio Mendez Arroyo | Controller | NA |
| Leonardo Karam Rosa | Gen. Mang. of Investor Relation | NA |
| Mr. Marcelo Rodolfo Chara | CEO & Member of the Executive Board | 1960 |
Disclaimer - (*)This information, including any data, is sourced from Unicorn Data Services SAS, trading as EOD Historical Data (“EODHD”) on an ‘as is’ basis, using their API. We cannot guarantee the completeness or validity of the information and data provided on this page, as well as via the API. In some cases, the data may include analyst ratings or recommendations sourced through the EODHD API, which are intended solely for general information purposes.
This information does not consider your personal objectives, financial situation, or needs. Kalkine is not liable for any errors or omissions in the information provided or for any actions taken in reliance on it. You should seek advice from a financial adviser, stockbroker or other professional adviser (including taxation and legal advice) as necessary before acting on this information.

Download a free report with stock ideas and industry insights for general information.
Download Free Report Now →


Basic Materials
 -1.01%
Communication Services
 +0.38%

Consumer Cyclical
+0.01%

Consumer Defensive
+0.56%

Energy
+0.45%

Financial Services
+0.07%
Financials
-0.27%

Healthcare
-0.36%

Industrials
-0.46%

Real Estate
+0.07%

Technology
-1.02%

Utilities
+0.24%
Note: Daily price change (%) by sector excluding stocks with +/-90% daily price change. Companies above $500 million market capitalization are considered.
 Portfolio
 Watchlist


 Please wait processing your request...