 CA
 NZ
 UK
 AU
 IND

 US


…
OTC Markets Group Inc. engages in the financial market business in the United States and internationally. It offers OTC Link Alternative Trading System, a dealer system to view and publish quotes; OTC Dealer, a real-time, front-end application that provides consolidated quotation, trading, and information system to attract and access market liquidity; OTC FIX, which uses the industry standard FIX protocol for quote submission, trading, and routing of execution reports; and OTC Link Electronic Communication Networks (ECN), a dealer network model with auto-execution functionality; OTC Link National Quotation Bureau (NQB), a matching engine model that allows for the distribution of market data. The company provides Real-Time Level 2 Data that provides liquidity display service for retail investors; Blue Sky Monitoring Service for analysis, review, and guidance about a company's compliance with the United States securities laws; and Virtual Investor Conferences, which allows issuers to communicate and engages with investors, as well as operates the OTCQX Best Market, OTCQB Venture Market, and Pink Open Market, and online capital raising solutions. Further, it offers OTCIQ, an investor relations portal. OTC Markets Group Inc. was founded in 1904 and is headquartered in New York, New York.
Source: TradingView
The charts and visual representations are sourced from TradingView through embedded widgets. For any issues with chart display, please visit the TradingView website
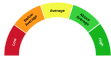
A unique technical analysis driven score developed by Kalkine showing momentum in stock prices based on select technical indicators identified.
OTC Markets Group operates U.S. over-the-counter securities marketplaces and sells market data, disclosure and issuer services to broker-dealers and public companies. Long-term growth may be driven by issuer migration to premium quotation tiers, expanding data and connectivity products, and greater retail and international participation, supporting recurring, high-margin revenue.
Material risks include sensitivity of revenue to trading volumes and issuer listings, potential regulatory changes to OTC market structure, competition from exchanges and data vendors, and operational threats such as cybersecurity or platform outages.

Note: The summary and risk score provided above is created by AI and should not be construed as a recommendation of Kalkine.


| Breakdown | 2022-12-31 | 2021-12-31 | 2020-12-31 | 2019-12-31 | 2018-12-31 |
|---|---|---|---|---|---|
| Type | yearly | yearly | yearly | yearly | yearly |
| Date | 2022-12-31 | 2021-12-31 | 2020-12-31 | 2019-12-31 | 2018-12-31 |
| Income before tax | 36.97M | 37.97M | 21.41M | 17.98M | 19.76M |
| Net income | 30.81M | 30.48M | 18.27M | 14.94M | 16.24M |
| Selling general administrative | 19.70M | 16.78M | 42.20M | 40.23M | 35.77M |
| Gross profit | 58.62M | 56.59M | 65.40M | 59.60M | 56.45M |
| Reconciled depreciation | 2.09M | 1.80M | 1.76M | 1.49M | 1.04M |
| Ebit | 36.82M | 38.02M | 21.43M | 17.88M | 19.64M |
| Ebitda | 38.91M | 39.81M | 23.20M | 19.37M | 20.69M |
| Operating income | 36.82M | 38.02M | 21.43M | 17.88M | 19.64M |
| Interest expense | - | 0.00M | 0.00M | 0.00M | 0.00M |
| Tax provision | 6.15M | 7.49M | 3.13M | 3.04M | 3.52M |
| Interest income | 0.15M | 0.00M | 0.02M | 0.11M | 0.08M |
| Net interest income | 0.15M | 0.00M | 0.02M | 0.11M | 0.08M |
| Income tax expense | 6.15M | 7.49M | 3.13M | 3.04M | 3.52M |
| Total revenue | 105.15M | 99.91M | 68.42M | 60.35M | 56.83M |
| Total operating expenses | 68.33M | 61.90M | 46.98M | 42.47M | 37.19M |
| Cost of revenue | 46.53M | 43.32M | 3.02M | 0.75M | 0.38M |
| Total other income expense net | -0.01M | -0.05M | -0.05M | -0.01M | 0.04M |
| Net income from continuing ops | 30.81M | 30.48M | 18.27M | 14.94M | 16.24M |
| Net income applicable to common shares | 30.81M | 29.77M | 17.84M | 14.59M | 15.84M |
| Breakdown | 2022-12-31 | 2021-12-31 | 2020-12-31 | 2019-12-31 | 2018-12-31 |
|---|---|---|---|---|---|
| Type | yearly | yearly | yearly | yearly | yearly |
| Date | 2022-12-31 | 2021-12-31 | 2020-12-31 | 2019-12-31 | 2018-12-31 |
| Total assets | 89.62M | 82.25M | 64.81M | 60.35M | 41.65M |
| Intangible assets | 7.99M | 0.04M | 0.04M | 0.04M | 0.06M |
| Other current assets | 0.06M | 0.79M | 0.39M | 0.38M | 0.70M |
| Total liab | 59.81M | 57.30M | 45.26M | 42.68M | 25.24M |
| Total stockholder equity | 29.80M | 24.95M | 19.55M | 17.67M | 16.41M |
| Other current liab | 31.02M | 28.45M | 18.78M | 15.91M | 16.07M |
| Common stock | 0.13M | 0.12M | 0.12M | 0.12M | 0.12M |
| Capital stock | 0.13M | 0.12M | 0.12M | 0.12M | 0.12M |
| Retained earnings | 21.25M | 16.79M | 11.77M | 8.11M | 7.72M |
| Other liab | 0.66M | 0.99M | 0.80M | 1.76M | 2.46M |
| Good will | 3.98M | 0.25M | 0.25M | 0.25M | 0.25M |
| Other assets | 6.99M | 2.08M | 2.20M | 2.60M | 2.60M |
| Cash | 37.37M | 50.39M | 33.73M | 28.22M | 28.81M |
| Total current liabilities | 45.85M | 41.76M | 30.00M | 25.39M | 22.78M |
| Property plant equipment | 22.27M | 19.94M | 20.21M | 22.44M | 1.98M |
| Total current assets | 48.38M | 59.95M | 42.10M | 35.03M | 36.75M |
| Net tangible assets | 17.83M | 24.66M | 19.25M | 17.38M | 16.10M |
| Net receivables | 9.48M | 7.40M | 6.61M | 5.16M | 4.94M |
| Accounts payable | 1.68M | 0.96M | 1.25M | 0.32M | 0.69M |
| Non currrent assets other | 2.13M | 1.69M | 1.86M | 1.83M | 1.56M |
| Non current assets total | 41.24M | 22.30M | 22.70M | 25.32M | 4.90M |
| Capital lease obligations | 15.24M | 16.46M | 16.29M | 17.47M | - |
| Breakdown | 2022-12-31 | 2021-12-31 | 2020-12-31 | 2019-12-31 | 2018-12-31 |
|---|---|---|---|---|---|
| Type | yearly | yearly | yearly | yearly | yearly |
| Date | 2022-12-31 | 2021-12-31 | 2020-12-31 | 2019-12-31 | 2018-12-31 |
| Investments | -16.39M | -1.40M | -1.03M | -5.52M | -0.55M |
| Change to liabilities | 0.00M | 9.39M | 3.87M | -0.63M | 0.46M |
| Total cashflows from investing activities | - | -1.40M | -1.03M | -5.52M | -0.55M |
| Total cash from financing activities | -30.31M | -28.40M | -19.46M | -16.65M | -15.88M |
| Change to operating activities | - | 2.55M | 1.24M | 2.41M | 0.43M |
| Net income | 30.81M | 30.48M | 18.27M | 14.94M | 16.24M |
| Change in cash | -13.02M | 16.66M | 5.52M | -0.76M | 6.16M |
| Begin period cash flow | 51.96M | 35.30M | 29.78M | 30.53M | 24.38M |
| End period cash flow | 38.94M | 51.96M | 35.30M | 29.78M | 30.53M |
| Total cash from operating activities | 33.68M | 46.46M | 26.01M | 21.41M | 22.59M |
| Issuance of capital stock | 0.00M | 0.00M | - | - | 0.00M |
| Depreciation | 2.09M | 1.80M | 1.76M | 1.49M | 1.04M |
| Dividends paid | 26.36M | 7.77M | 7.00M | 6.99M | 14.20M |
| Change to account receivables | -1.27M | -0.85M | -1.48M | -0.32M | 1.38M |
| Sale purchase of stock | -2.78M | -1.52M | -3.52M | -1.39M | -1.05M |
| Other cashflows from financing activities | - | 0.00M | 0.00M | 0.00M | 0.00M |
| Change to netincome | - | 2.39M | 2.49M | 2.21M | 1.49M |
| Capital expenditures | 1.44M | 1.40M | 1.03M | 4.85M | 0.55M |
| Change in working capital | 1.72M | 11.79M | 3.49M | 2.77M | 3.83M |
| Stock based compensation | 4.34M | 3.33M | 3.06M | 2.70M | - |
| Other non cash items | - | - | - | - | 0.68M |
| Free cash flow | 32.24M | 45.06M | 24.98M | 16.56M | 22.04M |
Sector: Financial Services Industry: Financial Data & Stock Exchanges
|
Stock Name
|
Change
(USD) |
Price
(USD) |
Trailing
PE (x) |
Forward
PE (x) |
Price Sales
TTM (x) |
Price to Book Value (x)
|
Enterprise Value
to Revenue (x) |
Enterprise Value
to EBITDA (x) |
|---|---|---|---|---|---|---|---|---|
| OTCM Otc Markets Group |
-0.95 1.79% |
52.20 | 23.17 | 21.41 | 6.88 | 18.42 | 6.22 | 18.45 |
| SPGI S&P Global Inc |
5.08 1.08% |
473.59 | 25.45 | 20.49 | 7.54 | 3.92 | 8.37 | 16.08 |
| CME CME Group Inc |
2.47 0.78% |
317.97 | 23.35 | 22.73 | 14.64 | 3.80 | 15.06 | 16.72 |
| MCO Moodys Corporation |
1.64 0.32% |
508.20 | 47.15 | 34.13 | 12.22 | 21.93 | 13.13 | 30.23 |
| ICE Intercontinental Exchange Inc |
0.65 0.37% |
178.51 | 28.62 | 21.79 | 9.36 | 2.78 | 9.72 | 19.58 |
OTC Markets Group Inc. engages in the financial market business in the United States and internationally. It offers OTC Link Alternative Trading System, a dealer system to view and publish quotes; OTC Dealer, a real-time, front-end application that provides consolidated quotation, trading, and information system to attract and access market liquidity; OTC FIX, which uses the industry standard FIX protocol for quote submission, trading, and routing of execution reports; and OTC Link Electronic Communication Networks (ECN), a dealer network model with auto-execution functionality; OTC Link National Quotation Bureau (NQB), a matching engine model that allows for the distribution of market data. The company provides Real-Time Level 2 Data that provides liquidity display service for retail investors; Blue Sky Monitoring Service for analysis, review, and guidance about a company's compliance with the United States securities laws; and Virtual Investor Conferences, which allows issuers to communicate and engages with investors, as well as operates the OTCQX Best Market, OTCQB Venture Market, and Pink Open Market, and online capital raising solutions. Further, it offers OTCIQ, an investor relations portal. OTC Markets Group Inc. was founded in 1904 and is headquartered in New York, New York.
| Name | Title | Year Born |
|---|---|---|
| Mr. Robert Cromwell Coulson | Pres, CEO & Director | 1967 |
| Ms. Antonia Georgieva | Chief Financial Officer | 1975 |
| Mr. Bruce Ostrover | Chief Technology Officer | 1963 |
| Mr. Daniel Zinn | Chief of Staff, Gen. Counsel & Corp. Sec. | 1978 |
| Mr. Jason L. Paltrowitz | Exec. VP of Corp. Services | 1973 |
| Ms. Lisabeth Heese | Exec. VP of Issuer Services | 1970 |
| Mr. Matthew Fuchs | Exec. VP of Market Data Licensing | 1976 |
| Mr. Michael Richard Modeski | Pres of OTC Link LLC | 1972 |
| Ms. Kristie Harkins | Chief Marketing Officer | NA |
| Mr. Bob Power | Sr. VP of Corp. Services | NA |
Disclaimer - (*)This information, including any data, is sourced from Unicorn Data Services SAS, trading as EOD Historical Data (“EODHD”) on an ‘as is’ basis, using their API. We cannot guarantee the completeness or validity of the information and data provided on this page, as well as via the API. In some cases, the data may include analyst ratings or recommendations sourced through the EODHD API, which are intended solely for general information purposes.
This information does not consider your personal objectives, financial situation, or needs. Kalkine is not liable for any errors or omissions in the information provided or for any actions taken in reliance on it. You should seek advice from a financial adviser, stockbroker or other professional adviser (including taxation and legal advice) as necessary before acting on this information.

Download a free report with stock ideas and industry insights for general information.
Download Free Report Now →

| No data available |
| ARE |
USD 43.53
 -0.71% |


Basic Materials
-1.01%
Communication Services
 +0.38%

Consumer Cyclical
+0.01%

Consumer Defensive
+0.56%

Energy
+0.45%

Financial Services
+0.07%
Financials
-0.27%

Healthcare
-0.36%

Industrials
-0.46%

Real Estate
+0.07%

Technology
-1.02%

Utilities
+0.24%
Note: Daily price change (%) by sector excluding stocks with +/-90% daily price change. Companies above $500 million market capitalization are considered.
 Portfolio
 Watchlist


 Please wait processing your request...