 CA
 NZ
 UK
 AU
 IND

 US


…
Bank of Communications Co., Ltd. provides commercial banking products and services in China and internationally. The company offers savings deposit products, including demand deposits, lump-sum deposits and withdrawal, time deposit of small savings for lump-sum withdrawal, interest withdrawal on principal deposited, time-demand deposit, call deposit, swap management, and education deposit; personal certificate of deposit; salary financing; and foreign currency deposit. It also provides credit, quasi-credit, and debit cards; new housing and second-hand mortgage loans and unsecured personal loans; personal wealth management advisor services; and precious metal and commodity trading services. In addition, the company offers corporate structured deposit and corporate certificate of deposit; corporate cash management; industrial chain finance program comprising prepayment financing, inventory financing, accounts receivable financing and accounts payable financing; syndicated loans; corporation overdraft; investment banking services; and offshore banking services, such as repayment financing, inventory financing, accounts receivable financing and accounts payable financing, and forex currencies. Further, the company provides bond account activation, bond distribution, and transaction services; related bond escrow and settlement, pledge registration, and principal and interest payment services; training and consulting services for cooperative banks; cross-border inter-bank payments system services; consignment sales of precious metal products; bond underwriting distribution; third party bond depository services; bank derivatives transfer; b-share transfer; bankfutures transfer; standard warehouse warrant pledged financing; institutional investment consulting, wealth management, and insurance services; and clearing and settlement services for future markets. The company was founded in 1908 and is headquartered in Shanghai, the People's Republic of China.
Source: TradingView
The charts and visual representations are sourced from TradingView through embedded widgets. For any issues with chart display, please visit the TradingView website
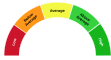
A unique technical analysis driven score developed by Kalkine showing momentum in stock prices based on select technical indicators identified.
Bank of Communications is a large Chinese commercial bank providing corporate and retail banking, trade finance, wealth management and payment services through an extensive branch and digital network. Long-term growth may be supported by scale, rising household financial assets, expanding fee-based businesses and digitalization, and the firm appears positioned to benefit from government-linked support and cross-border trade flows.
Principal risks include exposure to China’s property sector and corporate credit, sensitivity to macroeconomic slowdown and regulatory tightening that could weaken asset quality and margins, plus competitive pressure from fintech and nonbank lenders.

Note: The summary and risk score provided above is created by AI and should not be construed as a recommendation of Kalkine.


| Breakdown | 2025-12-31 | 2024-12-31 | 2023-12-31 | 2022-12-31 | 2021-12-31 |
|---|---|---|---|---|---|
| Type | yearly | yearly | yearly | yearly | yearly |
| Date | 2025-12-31 | 2024-12-31 | 2023-12-31 | 2022-12-31 | 2021-12-31 |
| Income before tax | 100603.08M | 103475.00M | 99698.00M | 98215.00M | 93959.00M |
| Minority interest | -892.00M | -643.00M | -254.00M | 119.00M | -1358.00M |
| Net income | 93154.39M | 93586.00M | 92728.00M | 92149.00M | 87581.00M |
| Selling general administrative | 24019.00M | 34286.00M | 77369.00M | 76825.00M | 74545.00M |
| Selling and marketing expenses | - | - | 13803.00M | - | - |
| Gross profit | 206291.46M | 258434.00M | 200624.00M | - | - |
| Reconciled depreciation | 20013.00M | 19372.00M | 18279.00M | - | - |
| Ebit | 100603.08M | - | 99342.00M | - | - |
| Ebitda | 120099.63M | - | 117621.00M | - | - |
| Depreciation and amortization | 19496.55M | 19372.00M | 18279.00M | - | - |
| Operating income | 101085.31M | 156166.00M | 109452.00M | - | - |
| Other operating expenses | 398282.72M | 92945.00M | 452486.00M | - | 23293.00M |
| Interest expense | 240014.16M | 281880.00M | 295738.00M | 248185.00M | 215953.00M |
| Tax provision | 7249.00M | 9246.00M | 7159.00M | 6185.00M | 5020.00M |
| Interest income | 419447.00M | 451712.00M | 454139.00M | 418122.00M | 377646.00M |
| Net interest income | 173075.00M | 169832.00M | 166076.00M | 169937.00M | 161693.00M |
| Income tax expense | 7061.93M | 9246.00M | 6446.00M | 6185.00M | 5020.00M |
| Total revenue | 498885.80M | 207028.00M | 200624.00M | 271947.00M | 268659.00M |
| Total operating expenses | 105688.38M | 102268.00M | 91172.00M | - | - |
| Cost of revenue | 292594.34M | 281880.00M | -55822.00M | - | - |
| Total other income expense net | -482.23M | -52691.00M | -9754.00M | - | - |
| Net income from continuing ops | 96514.00M | 94229.00M | 93679.00M | 92030.00M | 88939.00M |
| Net income applicable to common shares | - | - | - | 84666.00M | 81968.00M |
| Breakdown | 2025-12-31 | 2024-12-31 | 2023-12-31 | 2022-12-31 | 2021-12-31 |
|---|---|---|---|---|---|
| Type | yearly | yearly | yearly | yearly | yearly |
| Date | 2025-12-31 | 2024-12-31 | 2023-12-31 | 2022-12-31 | 2021-12-31 |
| Total assets | 15556241.78M | 14900717.00M | 14060472.00M | 12992419.00M | 11665757.00M |
| Intangible assets | 4820.00M | 4841.00M | 4628.00M | 3952.00M | 3874.00M |
| Other current assets | - | - | 247763.33M | - | 763047.00M |
| Total liab | 14356852.25M | 13745120.00M | 12961022.00M | 11956679.00M | 10688521.00M |
| Total stockholder equity | 1188333.95M | 1144306.00M | 1088030.00M | 1023409.00M | 964647.00M |
| Deferred long term liab | - | - | - | - | 721.00M |
| Other current liab | - | -14585.00M | -10075.00M | - | 45011.00M |
| Common stock | 88408.63M | 74263.00M | 74263.00M | 74263.00M | 74263.00M |
| Capital stock | 133316.00M | 119215.00M | 119215.00M | 74263.00M | 119215.00M |
| Retained earnings | 385766.76M | 348265.00M | 723423.00M | 666545.00M | 608343.00M |
| Other liab | - | - | - | - | 194881.00M |
| Good will | - | - | 58.47M | - | - |
| Other assets | - | 14900717.00M | -5718247.00M | - | 6633406.00M |
| Cash | 702201.52M | 1439200.00M | 1557273.00M | 1439890.00M | 9430485.00M |
| Total current liabilities | - | - | 3362915.00M | - | 10075192.00M |
| Current deferred revenue | - | - | 254.00M | - | - |
| Net debt | 3954760.61M | 628335.00M | -492127.00M | - | - |
| Short long term debt total | 4656962.13M | 641922.00M | 1065146.00M | - | - |
| Other stockholder equity | 136921.13M | 676826.00M | 111428.00M | - | 125661.00M |
| Property plant equipment | - | - | - | - | 177971.00M |
| Total current assets | 702201.52M | 1439200.00M | 1557273.00M | - | 1993800.00M |
| Long term investments | 4588547.00M | 4432065.00M | 3292570.00M | 3234569.00M | 3568248.00M |
| Net tangible assets | - | - | - | - | 915426.00M |
| Short term investments | - | - | -4179251.75M | - | - |
| Net receivables | - | - | - | - | 182389.00M |
| Inventory | - | - | - | - | 1030.00M |
| Accounts payable | - | - | 56930.00M | - | 7849611.00M |
| Accumulated other comprehensive income | 532262.72M | - | 133964.00M | - | - |
| Non currrent assets other | 413829.93M | 8736236.00M | 13811895.00M | - | - |
| Non current assets total | 14854040.26M | 13461517.00M | 18221446.00M | - | - |
| Breakdown | 2025-12-31 | 2024-12-31 | 2023-12-31 | 2022-12-31 | 2021-12-31 |
|---|---|---|---|---|---|
| Type | yearly | yearly | yearly | yearly | yearly |
| Date | 2025-12-31 | 2024-12-31 | 2023-12-31 | 2022-12-31 | 2021-12-31 |
| Investments | -145004.00M | -98089.00M | -323380.00M | -353223.00M | -353223.00M |
| Change to liabilities | - | - | - | 0.00M | 0.00M |
| Total cashflows from investing activities | -747320.90M | -98089.00M | -116623.00M | -284897.00M | -75548.00M |
| Net borrowings | 3569.00M | 97406.00M | 58231.00M | 16479.00M | 16479.00M |
| Total cash from financing activities | 593094.27M | 42520.00M | 4888.00M | - | 1306.00M |
| Change to operating activities | - | - | - | - | -141953.00M |
| Net income | 88410.07M | 94229.00M | 92728.00M | 92149.00M | 87581.00M |
| Change in cash | -35488.00M | -113511.00M | 26658.00M | 54495.00M | -112812.00M |
| Begin period cash flow | 161950.00M | 275461.00M | 248803.00M | 194308.00M | 307120.00M |
| End period cash flow | 126462.00M | 161950.00M | 275461.00M | 248803.00M | 194308.00M |
| Total cash from operating activities | 120052.87M | -57348.00M | 137323.00M | 368221.00M | -34775.00M |
| Depreciation | 20013.00M | 19372.00M | 18279.00M | - | 14463.00M |
| Other cashflows from investing activities | -526448.68M | 5820.00M | 9603.00M | 95733.00M | 89494.00M |
| Dividends paid | 38050.07M | 52182.00M | 50390.00M | 48939.00M | 44502.00M |
| Change to account receivables | - | -740428.00M | -831557.00M | - | - |
| Other cashflows from financing activities | 475121.31M | -2704.00M | -2953.00M | - | -564.00M |
| Change to netincome | - | - | - | - | 8225.00M |
| Capital expenditures | 39445.12M | 42175.00M | 47591.00M | 31655.00M | 22947.00M |
| Change in working capital | -36154.29M | -121137.00M | 70476.00M | 267534.00M | -145420.00M |
| Other non cash items | 67797.09M | -49812.00M | -44160.00M | -81325.00M | 16341.00M |
| Free cash flow | 80607.75M | -99523.00M | 89732.00M | 336566.00M | -57722.00M |
Sector: Financial Services Industry: Banks - Diversified
|
Stock Name
|
Change
(USD) |
Price
(USD) |
Trailing
PE (x) |
Forward
PE (x) |
Price Sales
TTM (x) |
Price to Book Value (x)
|
Enterprise Value
to Revenue (x) |
|---|---|---|---|---|---|---|---|
| BKFCF Bank of Communications Co. Ltd |
- -% |
1.09 | 5.30 | 5.72 | 0.39 | 0.43 | 6.59 |
| JPM JPMorgan Chase & Co |
-6.54 1.90% |
337.04 | 15.10 | 14.01 | 5.03 | 2.63 | 5.76 |
| IDCBF Industrial and Commercial Bank of China |
- -% |
1.00 | 6.53 | 6.02 | 0.67 | 0.56 | 5.72 |
| IDCBY Industrial and Commercial Bank of China |
0.55 2.77% |
20.38 | 6.49 | 6.00 | 0.65 | 0.55 | 5.72 |
| ACGBY Agricultural Bank of China PK |
0.31 1.41% |
22.24 | 6.92 | 6.73 | 0.67 | 0.60 | 6.34 |
Bank of Communications Co., Ltd. provides commercial banking products and services in China and internationally. The company offers savings deposit products, including demand deposits, lump-sum deposits and withdrawal, time deposit of small savings for lump-sum withdrawal, interest withdrawal on principal deposited, time-demand deposit, call deposit, swap management, and education deposit; personal certificate of deposit; salary financing; and foreign currency deposit. It also provides credit, quasi-credit, and debit cards; new housing and second-hand mortgage loans and unsecured personal loans; personal wealth management advisor services; and precious metal and commodity trading services. In addition, the company offers corporate structured deposit and corporate certificate of deposit; corporate cash management; industrial chain finance program comprising prepayment financing, inventory financing, accounts receivable financing and accounts payable financing; syndicated loans; corporation overdraft; investment banking services; and offshore banking services, such as repayment financing, inventory financing, accounts receivable financing and accounts payable financing, and forex currencies. Further, the company provides bond account activation, bond distribution, and transaction services; related bond escrow and settlement, pledge registration, and principal and interest payment services; training and consulting services for cooperative banks; cross-border inter-bank payments system services; consignment sales of precious metal products; bond underwriting distribution; third party bond depository services; bank derivatives transfer; b-share transfer; bankfutures transfer; standard warehouse warrant pledged financing; institutional investment consulting, wealth management, and insurance services; and clearing and settlement services for future markets. The company was founded in 1908 and is headquartered in Shanghai, the People's Republic of China.

No. 188, Yincheng Middle Road, Shanghai, China, 200120

86 21 5876 6688

97932
| Name | Title | Year Born |
|---|---|---|
| Mr. Deqi Ren | Exec. Chairman | 1963 |
| Mr. Jun Liu | Vice Chairman & Pres | 1972 |
| Mr. Bin Qian | Exec. VP & Chief Information Officer | 1973 |
| Mr. Sheng Gu | GM of HR Department, Company Sec. & Sec. of the Board | 1963 |
| Mr. Hong Tu | Chief Bus. Officer of Interbank & Market Bus. | 1966 |
| Mr. Jiuyong Yin | Exec. VP | 1967 |
| Mr. Wanfu Zhou | Exec. VP | 1965 |
| Mr. Cheng Hao | Exec. VP | 1972 |
| Mr. Hua Lin | Chief Risk Officer | 1968 |
| Mr. Eric Pan | Sr. Mang., IR Division | NA |
Disclaimer - (*)This information, including any data, is sourced from Unicorn Data Services SAS, trading as EOD Historical Data (“EODHD”) on an ‘as is’ basis, using their API. We cannot guarantee the completeness or validity of the information and data provided on this page, as well as via the API. In some cases, the data may include analyst ratings or recommendations sourced through the EODHD API, which are intended solely for general information purposes.
This information does not consider your personal objectives, financial situation, or needs. Kalkine is not liable for any errors or omissions in the information provided or for any actions taken in reliance on it. You should seek advice from a financial adviser, stockbroker or other professional adviser (including taxation and legal advice) as necessary before acting on this information.

Download a free report with stock ideas and industry insights for general information.
Download Free Report Now →


Basic Materials
 -1.82%
Communication Services
-0.22%

Consumer Cyclical
-0.13%

Consumer Defensive
 +0.32%

Energy
+0.15%

Financial Services
-0.85%
Financials
+2.34%

Healthcare
-1.28%

Industrials
-0.96%

Real Estate
-0.38%

Technology
-2.73%

Utilities
-0.31%
Note: Daily price change (%) by sector excluding stocks with +/-90% daily price change. Companies above $500 million market capitalization are considered.
 Portfolio
 Watchlist


 Please wait processing your request...