 CA
 NZ
 UK
 AU
 IND

 US


…
The Magnum Ice Cream Company N.V. engages in the ice cream business in the Netherlands. The company offers its products under the Magnum, Ben & Jerry's, Cornetto, and Wall's brands. It also operates in rest of Europe, North America, South America, Africa, Asia, the Middle East, Australia, and New Zealand. The company was incorporated in 2025 and is headquartered in Amsterdam, the Netherlands.
Source: TradingView
The charts and visual representations are sourced from TradingView through embedded widgets. For any issues with chart display, please visit the TradingView website
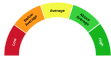
A unique technical analysis driven score developed by Kalkine showing momentum in stock prices based on select technical indicators identified.
Magnum Ice Cream Company N.V. is a publicly listed company that produces and markets branded ice cream and frozen-dessert products across retail and foodservice channels. Long-term growth may be supported by premiumization trends in frozen desserts, geographic expansion and product innovation that could lift margins and expand market reach. Investors may find the company attractive for its brand recognition and potential resilience of consumer demand, subject to execution risk.

Note: The summary and risk score provided above is created by AI and should not be construed as a recommendation of Kalkine.


| Breakdown | 2025-12-31 | 2024-12-31 | 2023-12-31 | 2022-12-31 |
|---|---|---|---|---|
| Type | yearly | yearly | yearly | yearly |
| Date | 2025-12-31 | 2024-12-31 | 2023-12-31 | 2022-12-31 |
| Income before tax | 446.86M | 583.00M | 712.00M | 700.00M |
| Minority interest | -14.00M | -16.00M | -17.00M | -18.00M |
| Net income | 292.91M | 450.00M | 492.00M | 509.00M |
| Selling general administrative | 1743.00M | 1718.00M | 1650.00M | 1598.00M |
| Gross profit | 7907.58M | 2774.00M | 2596.00M | 2566.00M |
| Reconciled depreciation | 338.00M | 376.00M | 357.00M | 372.00M |
| Ebit | 580.82M | 725.00M | 722.00M | 729.00M |
| Ebitda | 918.72M | 1101.00M | 1079.00M | 1101.00M |
| Depreciation and amortization | 337.90M | 376.00M | 357.00M | 372.00M |
| Operating income | 598.82M | 735.00M | 742.00M | 737.00M |
| Other operating expenses | 7308.76M | 7212.00M | 6876.00M | 6769.00M |
| Interest expense | 138.95M | 142.00M | 10.00M | 29.00M |
| Tax provision | 140.00M | 117.00M | 203.00M | 173.00M |
| Interest income | 27.00M | 2.00M | 1.00M | 1.00M |
| Net interest income | -112.00M | -140.00M | -9.00M | -28.00M |
| Income tax expense | 139.96M | 117.00M | 203.00M | 173.00M |
| Total revenue | 7907.58M | 7947.00M | 7618.00M | 7506.00M |
| Total operating expenses | 7308.76M | 2039.00M | 1854.00M | 1829.00M |
| Cost of revenue | 5171.00M | 5173.00M | 5022.00M | 4940.00M |
| Total other income expense net | -151.95M | -152.00M | -30.00M | -37.00M |
| Net income from continuing ops | 307.00M | 466.00M | 509.00M | 527.00M |
| Breakdown | 2025-12-31 | 2024-12-31 | 2023-12-31 | 2022-12-31 | 2021-12-31 |
|---|---|---|---|---|---|
| Type | yearly | yearly | yearly | yearly | yearly |
| Date | 2025-12-31 | 2024-12-31 | 2023-12-31 | 2022-12-31 | 2021-12-31 |
| Total assets | 7488.00M | 5521.00M | 5273.00M | 4745.00M | 4252.00M |
| Intangible assets | 731.00M | 793.00M | 754.00M | 381.00M | 366.00M |
| Other current assets | 1.00M | 117.00M | 109.00M | 135.00M | 89.00M |
| Total liab | 6855.00M | 2720.00M | 2738.00M | 2767.00M | 2627.00M |
| Total stockholder equity | 625.00M | 2778.00M | 2510.00M | 1953.00M | 1597.00M |
| Other current liab | 892.00M | 697.00M | 654.00M | 644.00M | 596.00M |
| Common stock | 2143.00M | 2385.00M | 2379.00M | 1775.00M | 1597.00M |
| Capital stock | 2143.00M | 2385.00M | 2379.00M | 1775.00M | 1597.00M |
| Retained earnings | -172.00M | 0.00M | - | - | - |
| Good will | 510.00M | 585.00M | 558.00M | 272.00M | 264.00M |
| Cash | 441.00M | 70.00M | 52.00M | 44.00M | 51.00M |
| Total current liabilities | 3107.00M | 2029.00M | 1956.00M | 1995.00M | 1804.00M |
| Net debt | 2814.00M | 118.00M | 145.00M | 144.00M | 133.00M |
| Short term debt | 77.00M | 85.00M | 73.00M | 73.00M | 62.00M |
| Short long term debt | 34.00M | 44.00M | 32.00M | 35.00M | 21.00M |
| Short long term debt total | 3255.00M | 188.00M | 197.00M | 188.00M | 184.00M |
| Other stockholder equity | 5798.00M | 393.00M | 131.00M | 178.00M | - |
| Total current assets | 3157.00M | 1629.00M | 1513.00M | 1625.00M | 1229.00M |
| Short term investments | 37.00M | 109.00M | 7.00M | 9.00M | 13.00M |
| Net receivables | 1805.00M | 413.00M | 430.00M | 446.00M | 325.00M |
| Long term debt | 3078.00M | 0.00M | 9.00M | 9.00M | 0.00M |
| Inventory | 873.00M | 920.00M | 915.00M | 991.00M | 751.00M |
| Accounts payable | 2059.00M | 1180.00M | 1156.00M | 1212.00M | 1085.00M |
| Accumulated other comprehensive income | -7144.00M | - | - | - | - |
| Non currrent assets other | 264.00M | 29.00M | 63.00M | 71.00M | 43.00M |
| Non current assets total | 4331.00M | 3892.00M | 3760.00M | 3120.00M | 3023.00M |
| Capital lease obligations | 143.00M | 144.00M | 156.00M | 144.00M | 163.00M |
| Breakdown | 2025-12-31 | 2024-12-31 | 2023-12-31 | 2022-12-31 |
|---|---|---|---|---|
| Type | yearly | yearly | yearly | yearly |
| Date | 2025-12-31 | 2024-12-31 | 2023-12-31 | 2022-12-31 |
| Investments | 0.00M | -1.00M | 2.00M | -1.00M |
| Total cashflows from investing activities | -329.88M | -373.71M | -854.00M | -258.00M |
| Net borrowings | -56.00M | -39.00M | -45.00M | 9.00M |
| Total cash from financing activities | 334.87M | -749.50M | -51.00M | -470.00M |
| Net income | 292.91M | 595.00M | 509.00M | 527.00M |
| Change in cash | 379.16M | 15.07M | 7.00M | -8.00M |
| Begin period cash flow | 61.68M | 57.39M | 43.00M | 51.00M |
| End period cash flow | 440.83M | 72.47M | 50.00M | 43.00M |
| Total cash from operating activities | 367.86M | 1140.81M | 914.00M | 721.00M |
| Depreciation | 337.90M | 376.00M | 357.00M | 372.00M |
| Other cashflows from investing activities | 27.01M | 22.10M | 26.00M | -0.80M |
| Dividends paid | 82.97M | 11.00M | 0.00M | 0.00M |
| Change to inventory | -48.98M | 3.11M | 54.00M | -228.00M |
| Change to account receivables | -1513.54M | 42.44M | 30.00M | -196.00M |
| Other cashflows from financing activities | -2659.00M | -740.18M | -47.99M | -479.00M |
| Capital expenditures | 356.89M | 332.31M | 280.00M | 295.00M |
| Change in working capital | -303.89M | 119.05M | 56.00M | -273.00M |
| Stock based compensation | 34.99M | 32.00M | 20.00M | 18.00M |
| Other non cash items | 5.95M | 17.60M | -28.00M | 77.00M |
| Free cash flow | 11.00M | 808.51M | 634.00M | 426.00M |
Sector: Consumer Defensive Industry: Packaged Foods
|
Stock Name
|
Change
(USD) |
Price
(USD) |
Trailing
PE (x) |
Forward
PE (x) |
Price Sales
TTM (x) |
Price to Book Value (x)
|
Enterprise Value
to Revenue (x) |
Enterprise Value
to EBITDA (x) |
|---|---|---|---|---|---|---|---|---|
| MICC The Magnum Ice Cream Company N.V. |
- -% |
19.47 | 56.41 | 15.82 | 1.44 | 9.64 | 1.67 | 15.22 |
| NSRGF Nestle SA |
0.03 0.03% |
105.03 | 26.86 | 18.76 | 3.13 | 7.10 | 3.81 | 21.70 |
| NSRGY Nestle SA ADR |
-1.79 1.71% |
103.01 | 26.82 | 18.66 | 3.18 | 7.07 | 3.81 | 21.70 |
| DANOY Danone PK |
-0.23 1.48% |
15.35 | 24.23 | 17.64 | 1.88 | 2.57 | 1.88 | 11.70 |
| GPDNF Danone S.A |
- -% |
78.15 | 20.30 | 14.75 | 1.65 | 2.24 | 1.76 | 10.92 |
The Magnum Ice Cream Company N.V. engages in the ice cream business in the Netherlands. The company offers its products under the Magnum, Ben & Jerry's, Cornetto, and Wall's brands. It also operates in rest of Europe, North America, South America, Africa, Asia, the Middle East, Australia, and New Zealand. The company was incorporated in 2025 and is headquartered in Amsterdam, the Netherlands.

Reguliersdwarsstraat 63, Amsterdam, Netherlands, 1017 BK

31 61 158 5067

19000
| Name | Title | Year Born |
|---|---|---|
| Mr. Peter Frank Ter Kulve | CEO & Executive Director | 1964 |
| Mr. Abhijit Bhattacharya | CFO & Executive Director | 1961 |
| Mr. Mark O'Brien | Chief Technology Officer | NA |
| Ms. Vanessa Vilar | Chief Legal Officer | NA |
| Mr. Julien Barraux | Chief Creative Officer and Chief Growth & Marketing Officer | NA |
| Mr. Ronald Adrianus Wilhelmus Schellekens | Chief Human Resources Officer | 1965 |
| Mr. Gerardo Rozanski | President of North America & Latin America | NA |
| Mr. Tahir Toloy Tanridagli | President of Ice Cream - South Asia, Middle East, Africa & Turkey | NA |
| Ms. Wai-Fung Loh | President of Asia | NA |
| Mr. Mustafa Seckin | President of Europe and Australia & New Zealand | NA |
Disclaimer - (*)This information, including any data, is sourced from Unicorn Data Services SAS, trading as EOD Historical Data (“EODHD”) on an ‘as is’ basis, using their API. We cannot guarantee the completeness or validity of the information and data provided on this page, as well as via the API. In some cases, the data may include analyst ratings or recommendations sourced through the EODHD API, which are intended solely for general information purposes.
This information does not consider your personal objectives, financial situation, or needs. Kalkine is not liable for any errors or omissions in the information provided or for any actions taken in reliance on it. You should seek advice from a financial adviser, stockbroker or other professional adviser (including taxation and legal advice) as necessary before acting on this information.

Download a free report with stock ideas and industry insights for general information.
Download Free Report Now →


Basic Materials
 -0.44%
Communication Services
-0.67%

Consumer Cyclical
-0.51%

Consumer Defensive
-0.25%

Energy
-0.53%

Financial Services
-0.68%
Financials
-1.31%

Healthcare
-0.50%

Industrials
-0.60%

Real Estate
-0.34%

Technology
-1.10%

Utilities
-0.41%
Note: Daily price change (%) by sector excluding stocks with +/-90% daily price change. Companies above $500 million market capitalization are considered.
 Portfolio
 Watchlist


 +155.35%
 Please wait processing your request...