 CA
 NZ
 UK
 AU
 IND

 US


…
FLEETCOR Technologies, Inc., a business payments company that helps businesses spend less by enabling them to manage their expense-related purchasing and vendor payments processes. It offers corporate payments solutions, such as accounts payable automation; Virtual Card, which provides a single-use card number for a specific amount usable within a defined timeframe; Cross-Border that is used by its customers to pay international vendors, foreign office and personnel expenses, capital expenditures, and profit repatriation and dividends; and purchasing cards and travel and entertainment cards for its customers to analyze and manage their corporate spending. The company also provides vehicle and mobility solutions, including fuel solutions to businesses and government entities that operate vehicle fleets, as well as to oil and leasing companies, and fuel marketers; lodging solutions to businesses that have employees who travel overnight for work purposes, as well as to airlines and cruise lines to accommodate traveling crews and stranded passengers; and electronic toll payments solutions to businesses and consumers in the form of radio frequency identification tags affixed to vehicles' windshields. In addition, it offers gift card program management and processing services in plastic and digital forms that include card design, production and packaging, delivery and fulfillment, card and account management, transaction processing, promotion development and management, website design and hosting, program analytics, and card distribution channel management. Further, the company provides other products consisting of payroll cards, vehicle maintenance service solution, long-haul transportation solution, prepaid food vouchers or cards, and prepaid transportation cards and vouchers. It serves business, merchant, consumer, and payment network customers in North America, Brazil, and Internationally. The company was founded in 1986 and is headquartered in Atlanta, Georgia.
Source: TradingView
The charts and visual representations are sourced from TradingView through embedded widgets. For any issues with chart display, please visit the TradingView website
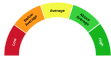
A unique technical analysis driven score developed by Kalkine showing momentum in stock prices based on select technical indicators identified.


| Breakdown | 2022-12-31 | 2021-12-31 | 2020-12-31 | 2019-12-31 | 2018-12-31 |
|---|---|---|---|---|---|
| Type | yearly | yearly | yearly | yearly | yearly |
| Date | 2022-12-31 | 2021-12-31 | 2020-12-31 | 2019-12-31 | 2018-12-31 |
| Income before tax | 1275.66M | 1108.81M | 882.52M | 1077.82M | 1095.12M |
| Net income | 954.33M | 839.50M | 704.22M | 895.07M | 811.48M |
| Selling general administrative | 584.13M | 485.83M | 374.68M | 407.21M | 389.17M |
| Selling and marketing expenses | 309.08M | 262.12M | 192.73M | 204.81M | 182.59M |
| Gross profit | 2662.42M | 2273.92M | 1792.49M | 2118.18M | 1945.80M |
| Reconciled depreciation | 322.28M | 284.20M | 254.80M | 274.21M | 269.27M |
| Ebit | 1446.64M | 1242.56M | 972.26M | 1231.43M | 1248.21M |
| Ebitda | 1765.92M | 1522.89M | 1237.12M | 1505.55M | 1517.47M |
| Depreciation and amortization | 319.28M | 280.34M | 264.86M | 274.12M | 269.27M |
| Non operating income net other | - | -20.04M | 40.06M | -3.56M | 142.92M |
| Operating income | 1446.64M | 1242.56M | 972.26M | 1231.43M | 1090.70M |
| Other operating expenses | 1980.49M | 1591.18M | 1416.59M | 1417.42M | 1342.79M |
| Interest expense | 164.66M | 113.70M | 129.80M | 150.05M | 138.49M |
| Tax provision | 321.33M | 269.31M | 178.31M | 182.75M | 283.64M |
| Interest income | 166.04M | 113.70M | 99.80M | 64.72M | 145.74M |
| Net interest income | -164.66M | -113.70M | -129.80M | -150.05M | -138.49M |
| Extraordinary items | - | - | - | 0.00M | -24.51M |
| Income tax expense | 321.33M | 269.31M | 178.31M | 182.75M | 283.64M |
| Total revenue | 3427.13M | 2833.74M | 2388.86M | 2648.85M | 2433.49M |
| Total operating expenses | 1215.78M | 1031.36M | 820.23M | 886.75M | 855.10M |
| Cost of revenue | 764.71M | 559.82M | 596.36M | 530.67M | 487.69M |
| Total other income expense net | -170.98M | -133.75M | -89.74M | -153.61M | 142.92M |
| Net income from continuing ops | 954.33M | 839.50M | 704.22M | 895.07M | 811.48M |
| Net income applicable to common shares | 954.33M | 839.50M | 704.22M | 895.07M | 811.48M |
| Breakdown | 2022-12-31 | 2021-12-31 | 2020-12-31 | 2019-12-31 | 2018-12-31 |
|---|---|---|---|---|---|
| Type | yearly | yearly | yearly | yearly | yearly |
| Date | 2022-12-31 | 2021-12-31 | 2020-12-31 | 2019-12-31 | 2018-12-31 |
| Total assets | 14093.18M | 13366.45M | 11194.58M | 12207.59M | 11182.11M |
| Intangible assets | 2130.97M | 2306.49M | 2115.88M | 2341.88M | 2407.91M |
| Other current assets | 469.15M | 2174.75M | 1654.64M | 1419.03M | 1419.03M |
| Total liab | 11551.69M | 10499.87M | 7839.17M | 8495.97M | 7841.93M |
| Total stockholder equity | 2541.49M | 2866.58M | 3355.41M | 3711.62M | 3340.18M |
| Deferred long term liab | 50.70M | 566.29M | 498.15M | 519.98M | 491.95M |
| Other current liab | 655.45M | 539.46M | 532.81M | 459.01M | 380.26M |
| Common stock | 0.13M | 0.13M | 0.13M | 0.12M | 0.12M |
| Capital stock | 0.13M | 0.13M | 0.13M | 0.12M | 0.12M |
| Retained earnings | 7210.77M | 6256.44M | 5416.94M | 4712.73M | 3817.66M |
| Other liab | 694.80M | 787.68M | 743.93M | 702.21M | 618.65M |
| Good will | 5201.44M | 5107.88M | 4719.18M | 4833.05M | 4542.07M |
| Other assets | 281.73M | 213.93M | 200.69M | 140.48M | 147.63M |
| Cash | 1435.16M | 1520.03M | 934.90M | 1271.49M | 1034.52M |
| Cash and equivalents | 1435.16M | 1520.03M | 934.90M | 1271.49M | 1031.14M |
| Total current liabilities | 6043.45M | 5252.15M | 3968.31M | 4422.11M | 4474.84M |
| Current deferred revenue | 1505.00M | 1788.70M | 1175.32M | 1007.63M | 906.32M |
| Net debt | 5601.73M | 4457.64M | 3397.72M | 3765.29M | 3784.53M |
| Short term debt | 2314.06M | 1517.63M | 1205.70M | 1746.84M | 2070.62M |
| Short long term debt | 2314.06M | 1517.63M | 1205.70M | 1746.84M | 2070.62M |
| Short long term debt total | 7036.89M | 5977.67M | 4332.62M | 5036.78M | 4819.05M |
| Other stockholder equity | -3159.75M | -1925.37M | -698.50M | -28.77M | 436.26M |
| Property plant equipment | 294.69M | 236.29M | 202.51M | 199.82M | 186.20M |
| Total current assets | 6110.07M | 5449.84M | 3956.32M | 4577.62M | 3855.62M |
| Long term investments | 74.28M | 52.02M | 7.48M | 30.44M | 42.67M |
| Net tangible assets | -4790.92M | -4547.78M | -3479.65M | -3463.31M | -3609.80M |
| Short term investments | - | - | 7.48M | - | - |
| Net receivables | 2064.74M | 1731.57M | 1366.78M | 1528.01M | 1422.44M |
| Long term debt | 4722.84M | 4460.04M | 3126.93M | 3289.95M | 2748.43M |
| Inventory | 2141.02M | 23.50M | - | 359.09M | -20.37M |
| Accounts payable | 1568.94M | 1406.35M | 1054.48M | 1208.63M | 1117.65M |
| Accumulated other comprehensive income | -1509.65M | -1464.62M | -1363.16M | -972.47M | -913.86M |
| Common stock total equity | - | 0.13M | 0.13M | 0.12M | 0.12M |
| Retained earnings total equity | - | 6256.44M | 5416.94M | 4712.73M | 3817.66M |
| Treasury stock | - | -4804.12M | -3448.40M | -2523.49M | -1870.58M |
| Non currrent assets other | -245.74M | -352.36M | -304.94M | -267.17M | -371.28M |
| Non current assets total | 7983.11M | 7916.60M | 7238.26M | 7629.97M | 7326.49M |
| Long term debt total | 4722.84M | 4460.04M | 3126.93M | 3289.95M | 2748.43M |
| Breakdown | 2022-12-31 | 2021-12-31 | 2020-12-31 | 2019-12-31 | 2018-12-31 |
|---|---|---|---|---|---|
| Type | yearly | yearly | yearly | yearly | yearly |
| Date | 2022-12-31 | 2021-12-31 | 2020-12-31 | 2019-12-31 | 2018-12-31 |
| Investments | -368.35M | -715.93M | 52.96M | -523.70M | -26.27M |
| Change to liabilities | -83.95M | 416.03M | 89.98M | 198.76M | 27.39M |
| Total cashflows from investing activities | -368.35M | -715.93M | -106.25M | -523.70M | -26.27M |
| Net borrowings | 1055.19M | 1690.60M | -449.94M | 215.76M | 324.31M |
| Total cash from financing activities | -311.23M | 343.93M | -1416.80M | -310.17M | -577.82M |
| Change to operating activities | -69.87M | 219.49M | -1.86M | -192.18M | -53.08M |
| Net income | 954.33M | 839.50M | 704.22M | 895.07M | 811.48M |
| Change in cash | 38.48M | 774.08M | -198.62M | 310.34M | 217.03M |
| Begin period cash flow | 2250.70M | 1476.62M | 1675.24M | 1364.89M | 1130.87M |
| End period cash flow | 2289.18M | 2250.70M | 1476.62M | 1675.24M | 1347.90M |
| Total cash from operating activities | 754.80M | 1195.26M | 1467.70M | 1162.07M | 886.39M |
| Issuance of capital stock | 49.40M | 48.78M | 136.80M | 168.93M | 55.68M |
| Depreciation | 322.28M | 284.20M | 254.80M | 274.21M | 269.27M |
| Other cashflows from investing activities | -216.92M | -2.28M | -80.79M | -448.53M | 55.12M |
| Dividends paid | - | -4228.00M | -971.49M | -2649.48M | 1946.52M |
| Change to inventory | - | -37.92M | -248.53M | -91.76M | -74.38M |
| Change to account receivables | 131.10M | 37.92M | 158.55M | 64.38M | -155.65M |
| Sale purchase of stock | -1405.20M | -1355.72M | -849.91M | -694.91M | -958.70M |
| Other cashflows from financing activities | 10394.57M | 8416.27M | 1939.99M | 5296.14M | 3889.00M |
| Change to netincome | 226.01M | 158.36M | 154.83M | 175.32M | -12.12M |
| Capital expenditures | 151.43M | 111.53M | 78.42M | 75.17M | 81.39M |
| Change receivables | - | -731.14M | 264.14M | -196.03M | -159.02M |
| Cash flows other operating | - | 431.73M | 187.75M | 21.06M | -44.29M |
| Exchange rate changes | - | - | - | - | -65.27M |
| Cash and cash equivalents changes | - | 825.06M | -50.46M | 328.20M | 234.02M |
| Change in working capital | -752.50M | -93.62M | 185.20M | -186.24M | -228.07M |
| Stock based compensation | 121.42M | 80.07M | 43.38M | 60.95M | 69.94M |
| Other non cash items | 142.44M | 60.15M | 133.04M | 83.41M | -59.84M |
| Free cash flow | 603.37M | 1083.73M | 1389.27M | 1086.90M | 805.00M |
Sector: Technology Industry: Software - Infrastructure
|
Stock Name
|
Change
(USD) |
Price
(USD) |
Trailing
PE (x) |
Forward
PE (x) |
Price Sales
TTM (x) |
Price to Book Value (x)
|
Enterprise Value
to Revenue (x) |
Enterprise Value
to EBITDA (x) |
|---|---|---|---|---|---|---|---|---|
| MSFT Microsoft Corporation |
0.88 0.17% |
523.88 | 37.32 | 29.94 | 13.03 | 12.45 | 13.06 | 24.59 |
| ORCL Oracle Corporation |
-1.76 1.38% |
125.35 | 21.96 | 17.89 | 5.91 | 7.08 | 7.82 | 14.89 |
| CRWD Crowdstrike Holdings Inc |
-3.26 1.42% |
226.61 | 4849.80 | 188.68 | 46.01 | 47.24 | 43.89 | 559.34 |
| FTNT Fortinet Inc |
-2.32 1.79% |
127.22 | 60.27 | 43.86 | 16.80 | 80.50 | 16.11 | 43.33 |
FLEETCOR Technologies, Inc., a business payments company that helps businesses spend less by enabling them to manage their expense-related purchasing and vendor payments processes. It offers corporate payments solutions, such as accounts payable automation; Virtual Card, which provides a single-use card number for a specific amount usable within a defined timeframe; Cross-Border that is used by its customers to pay international vendors, foreign office and personnel expenses, capital expenditures, and profit repatriation and dividends; and purchasing cards and travel and entertainment cards for its customers to analyze and manage their corporate spending. The company also provides vehicle and mobility solutions, including fuel solutions to businesses and government entities that operate vehicle fleets, as well as to oil and leasing companies, and fuel marketers; lodging solutions to businesses that have employees who travel overnight for work purposes, as well as to airlines and cruise lines to accommodate traveling crews and stranded passengers; and electronic toll payments solutions to businesses and consumers in the form of radio frequency identification tags affixed to vehicles' windshields. In addition, it offers gift card program management and processing services in plastic and digital forms that include card design, production and packaging, delivery and fulfillment, card and account management, transaction processing, promotion development and management, website design and hosting, program analytics, and card distribution channel management. Further, the company provides other products consisting of payroll cards, vehicle maintenance service solution, long-haul transportation solution, prepaid food vouchers or cards, and prepaid transportation cards and vouchers. It serves business, merchant, consumer, and payment network customers in North America, Brazil, and Internationally. The company was founded in 1986 and is headquartered in Atlanta, Georgia.
| Name | Title | Year Born |
|---|---|---|
| Mr. Ronald F. Clarke | Chairman, Pres & CEO | 1956 |
| Mr. John S. Coughlin | Sr. Advisor | 1968 |
| Mr. Armando Lins Netto | Group Pres of Brazil | 1968 |
| Ms. Alissa B. Vickery | Chief Accounting Officer, Sr. VP of Accounting & Controls and Interim CFO | 1978 |
| Mr. Scott A. Dufour | Chief Information Officer | 1969 |
| Mr. James P. Eglseder | Head of Investor Relations | NA |
| Mr. Daniel S. Fishbein | Gen. Counsel | 1974 |
| Mr. Steve C. Greene | Exec. VP of Corp. Devel. & Strategy | NA |
| Mr. Dan Csont | Chief Marketing Officer | NA |
| Ms. Crystal Williams | Chief HR Officer | NA |
Disclaimer - (*)This information, including any data, is sourced from Unicorn Data Services SAS, trading as EOD Historical Data (“EODHD”) on an ‘as is’ basis, using their API. We cannot guarantee the completeness or validity of the information and data provided on this page, as well as via the API. In some cases, the data may include analyst ratings or recommendations sourced through the EODHD API, which are intended solely for general information purposes.
This information does not consider your personal objectives, financial situation, or needs. Kalkine is not liable for any errors or omissions in the information provided or for any actions taken in reliance on it. You should seek advice from a financial adviser, stockbroker or other professional adviser (including taxation and legal advice) as necessary before acting on this information.

Download a free report with stock ideas and industry insights for general information.
Download Free Report Now →


Basic Materials
 -1.02%
Communication Services
 +0.42%

Consumer Cyclical
+0.04%

Consumer Defensive
+0.52%

Energy
+0.40%

Financial Services
+0.10%
Financials
-0.27%

Healthcare
-0.31%

Industrials
-0.44%

Real Estate
+0.05%

Technology
-1.04%

Utilities
+0.19%
Note: Daily price change (%) by sector excluding stocks with +/-90% daily price change. Companies above $500 million market capitalization are considered.
 Portfolio
 Watchlist


 Please wait processing your request...