 CA
 NZ
 UK
 AU
 IND

 US


…
SS Innovations International, Inc., together with its subsidiaries, operates as a commercial-stage surgical robotics company in India, Philippines, Indonesia, South America, Iraq, Cyprus, Oman, United Arab Emirates (UAE), Nepal, and internationally. It offers SSi Mantra, a surgical robotic system; and SSi Mudra, a range of stapling, energy, and core instrumentations for surgical systems. The company also develops NADI " Automated Coronary Anastomotic Connector, a micro stapling device; SSi Multi-Fire Clip Applier, a cartridge-based clip applicator; SSi Robotic Stapler; SSi Maya is an enabling digital platform that compliments the SSI Mantra system and enhances surgical capabilities; SSi Guru is a virtual tele illustration; SSi XR Cognitive Skill Simulator is an extended reality (XR) software platform developed to train and educate surgeons and surgical assistants; SSi MantraM; SSi Mantra Tele Surgeon Console (TSC); and 5mm surgical instruments; SSi Holographic Anatomy, an augmented reality tool; SSi Chitrasa " Advanced DICOM Viewer, an AI enabled application viewer; and SSi Mixed Reality Headset, a medical-grade device. In addition, it offers instrument tips, including forceps, scissors, electrocautery tools, scalpels, and other surgical tools. Further, the company provides accessory products, such as sterile drapes, 3d stereo endoscopes, cannulas, and seals, as well as tele proctoring and telesurgery products. Additionally, it offers installation, repair, maintenance, 24/7 technical support, and proactive health monitoring services. The company sells its products through direct sales organizations and distributor networks. SS Innovations International, Inc. is headquartered in Gurugram, India.
Source: TradingView
The charts and visual representations are sourced from TradingView through embedded widgets. For any issues with chart display, please visit the TradingView website
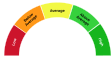
A unique technical analysis driven score developed by Kalkine showing momentum in stock prices based on select technical indicators identified.


| Breakdown | 2025-12-31 | 2024-12-31 | 2023-12-31 | 2022-12-31 | 2021-12-31 |
|---|---|---|---|---|---|
| Type | yearly | yearly | yearly | yearly | yearly |
| Date | 2025-12-31 | 2024-12-31 | 2023-12-31 | 2022-12-31 | 2021-12-31 |
| Income before tax | -8.16M | -19.15M | -20.94M | -2.21M | -1.48M |
| Net income | -12.13M | -19.15M | -20.94M | -2.21M | -1.48M |
| Selling general administrative | 22.98M | 24.50M | 20.81M | 2.37M | 1.41M |
| Gross profit | 19.54M | 8.45M | 0.71M | - | - |
| Reconciled depreciation | 1.08M | 0.44M | 0.16M | 0.01M | 0.02M |
| Ebit | -7.05M | -18.18M | -20.42M | - | - |
| Ebitda | -5.98M | -17.74M | -20.26M | -2.16M | -1.47M |
| Depreciation and amortization | 1.08M | 0.44M | 0.16M | - | - |
| Operating income | -8.19M | -18.98M | -20.67M | -2.45M | -1.41M |
| Other operating expenses | 50.68M | 39.63M | 26.55M | - | - |
| Interest expense | 1.11M | 0.97M | 0.52M | 0.05M | 0.00M |
| Tax provision | 3.97M | 0.00M | 0.00M | 0.00M | 0.00M |
| Interest income | 1.14M | 0.80M | 0.13M | 0.00M | 0.00M |
| Net interest income | 0.03M | -0.18M | -0.39M | -0.05M | 0.00M |
| Income tax expense | 3.97M | - | -0.00M | - | - |
| Total revenue | 42.48M | 20.65M | 5.88M | 0.00M | 0.00M |
| Total operating expenses | 27.74M | 27.43M | 21.38M | 2.45M | 1.41M |
| Cost of revenue | 22.94M | 12.20M | 5.17M | - | - |
| Total other income expense net | 0.03M | -0.18M | -0.27M | 0.28M | -0.08M |
| Net income from continuing ops | -12.13M | -19.15M | -20.94M | -2.21M | -1.48M |
| Breakdown | 2025-12-31 | 2024-12-31 | 2023-12-31 | 2022-12-31 | 2021-12-31 |
|---|---|---|---|---|---|
| Type | yearly | yearly | yearly | yearly | yearly |
| Date | 2025-12-31 | 2024-12-31 | 2023-12-31 | 2022-12-31 | 2021-12-31 |
| Total assets | 74.23M | 42.39M | 25.48M | 4.37M | 0.43M |
| Intangible assets | - | - | 0.04M | - | - |
| Other current assets | 10.30M | 9.59M | 3.38M | 0.01M | 0.00M |
| Total liab | 36.01M | 28.93M | 11.18M | 4.05M | 0.29M |
| Total stockholder equity | 38.22M | 13.46M | 14.30M | 0.32M | 0.14M |
| Other current liab | 5.83M | 1.31M | 2.04M | - | - |
| Common stock | 0.02M | 0.02M | 0.07M | - | - |
| Capital stock | 0.02M | 0.02M | 0.02M | 0.01M | 0.46M |
| Retained earnings | -55.79M | -43.66M | -35.33M | -10.69M | -8.48M |
| Other assets | - | - | 0.00M | - | - |
| Cash | 3.21M | 0.47M | 7.03M | 1.35M | 0.41M |
| Total current liabilities | 26.24M | 21.33M | 9.27M | 4.05M | 0.29M |
| Current deferred revenue | 3.27M | 1.28M | 0.02M | - | - |
| Net debt | 11.15M | 17.74M | 1.19M | 2.65M | - |
| Short term debt | 12.02M | 15.85M | 6.31M | - | - |
| Short long term debt | 11.44M | 15.44M | 6.02M | 4.00M | 0.14M |
| Short long term debt total | 14.36M | 18.20M | 8.22M | - | - |
| Other stockholder equity | 95.11M | 56.95M | 48.86M | - | - |
| Total current assets | 48.80M | 27.42M | 18.38M | 4.36M | 0.41M |
| Long term investments | - | - | - | - | 0.00M |
| Net receivables | 18.23M | 7.16M | 1.65M | - | - |
| Inventory | 17.06M | 10.21M | 6.33M | - | - |
| Accounts payable | 5.13M | 2.89M | 0.90M | 0.00M | 0.12M |
| Accumulated other comprehensive income | -1.12M | 0.15M | 0.70M | - | - |
| Non currrent assets other | 4.01M | 3.34M | 1.43M | - | - |
| Non current assets total | 25.43M | 14.97M | 7.10M | 0.01M | 0.02M |
| Capital lease obligations | 2.92M | 2.76M | 2.20M | - | - |
| Breakdown | 2025-12-31 | 2024-12-31 | 2023-12-31 | 2022-12-31 | 2021-12-31 |
|---|---|---|---|---|---|
| Type | yearly | yearly | yearly | yearly | yearly |
| Date | 2025-12-31 | 2024-12-31 | 2023-12-31 | 2022-12-31 | 2021-12-31 |
| Investments | - | -0.66M | -2.30M | -3.00M | 0.04M |
| Total cashflows from investing activities | -3.66M | -0.66M | -0.45M | - | - |
| Net borrowings | 26.17M | 9.43M | 22.33M | - | - |
| Total cash from financing activities | 26.17M | 9.43M | 22.80M | 5.38M | 0.57M |
| Net income | -12.13M | -19.15M | -20.88M | -2.21M | -1.48M |
| Change in cash | 2.98M | -0.46M | 6.81M | -0.95M | 0.25M |
| Begin period cash flow | 6.62M | 7.09M | 0.27M | 0.41M | 0.16M |
| End period cash flow | 9.60M | 6.62M | 7.09M | 1.35M | 0.41M |
| Total cash from operating activities | -18.54M | -9.50M | -15.36M | -1.44M | -0.36M |
| Issuance of capital stock | - | 0.00M | 0.81M | 1.53M | 0.58M |
| Depreciation | 1.08M | 0.44M | 0.15M | 0.01M | 0.02M |
| Other cashflows from investing activities | - | - | 0.46M | - | - |
| Change to inventory | -8.07M | -7.69M | -6.11M | - | - |
| Change to account receivables | -13.04M | -4.89M | -3.07M | - | - |
| Sale purchase of stock | - | - | - | - | -0.03M |
| Other cashflows from financing activities | 26.17M | - | 0.05M | - | - |
| Capital expenditures | 3.66M | 0.66M | 0.45M | 0.00M | 0.00M |
| Change in working capital | -15.79M | -6.08M | -9.66M | -0.10M | -0.85M |
| Stock based compensation | 8.13M | 14.34M | 9.72M | 0.87M | 0.77M |
| Other non cash items | 0.69M | 0.95M | 5.30M | -0.00M | 1.11M |
| Free cash flow | -22.20M | -10.16M | -15.81M | -1.44M | -0.36M |
Sector: Healthcare Industry: Medical Devices
|
Stock Name
|
Change
(USD) |
Price
(USD) |
Trailing
PE (x) |
Forward
PE (x) |
Price Sales
TTM (x) |
Price to Book Value (x)
|
Enterprise Value
to Revenue (x) |
Enterprise Value
to EBITDA (x) |
|---|---|---|---|---|---|---|---|---|
| SSII SS Innovations International Inc. Common Stock |
-0.01 0.47% |
2.10 | - | - | 12.62 | 12.66 | 12.99 | -24.73 |
| ABT Abbott Laboratories |
-0.36 0.33% |
109.56 | 25.97 | 17.24 | 3.57 | 3.20 | 3.81 | 16.75 |
| MDT Medtronic PLC |
-0.14 0.14% |
101.66 | 26.60 | 15.87 | 3.35 | 2.08 | 3.90 | 14.12 |
| SYK Stryker Corporation |
-0.84 0.26% |
325.03 | 29.23 | 16.86 | 4.18 | 4.51 | 4.63 | 17.16 |
| SEMHF Siemens Healthineers AG |
0.56 1.12% |
50.41 | 39.57 | 21.32 | 3.01 | 3.29 | 2.95 | 16.92 |
SS Innovations International, Inc., together with its subsidiaries, operates as a commercial-stage surgical robotics company in India, Philippines, Indonesia, South America, Iraq, Cyprus, Oman, United Arab Emirates (UAE), Nepal, and internationally. It offers SSi Mantra, a surgical robotic system; and SSi Mudra, a range of stapling, energy, and core instrumentations for surgical systems. The company also develops NADI " Automated Coronary Anastomotic Connector, a micro stapling device; SSi Multi-Fire Clip Applier, a cartridge-based clip applicator; SSi Robotic Stapler; SSi Maya is an enabling digital platform that compliments the SSI Mantra system and enhances surgical capabilities; SSi Guru is a virtual tele illustration; SSi XR Cognitive Skill Simulator is an extended reality (XR) software platform developed to train and educate surgeons and surgical assistants; SSi MantraM; SSi Mantra Tele Surgeon Console (TSC); and 5mm surgical instruments; SSi Holographic Anatomy, an augmented reality tool; SSi Chitrasa " Advanced DICOM Viewer, an AI enabled application viewer; and SSi Mixed Reality Headset, a medical-grade device. In addition, it offers instrument tips, including forceps, scissors, electrocautery tools, scalpels, and other surgical tools. Further, the company provides accessory products, such as sterile drapes, 3d stereo endoscopes, cannulas, and seals, as well as tele proctoring and telesurgery products. Additionally, it offers installation, repair, maintenance, 24/7 technical support, and proactive health monitoring services. The company sells its products through direct sales organizations and distributor networks. SS Innovations International, Inc. is headquartered in Gurugram, India.

405, iLabs Info Technology Centre, Gurugram, India, 122016

91 73 3755 3469

483
| Name | Title | Year Born |
|---|---|---|
| Dr. Sudhir Prem Srivastava M.D. | Founder, CEO & Chairman | 1948 |
| Dr. Vishwajyoti P. Srivastava M.D. | Chief Executive Officer of APAC & Director | 1978 |
| Mr. Barry F. Cohen | COO of Americas & Director | 1940 |
| Amit Garg | Manager of Finance & Accounts | NA |
| Vilayat Ali | Head of Marketing & Digital Media | NA |
| Amitesh Nigam | Head of Human Resources | NA |
| Mr. Colin Eke | Senior Vice President of Global Business Development | NA |
| Rama Krishna Reddy | CTO of South Asia | NA |
| Mr. Avinash Kumar | Chief Operating Officer of India | NA |
| Mr. Rahul Kumar | Head of IP | NA |
Disclaimer - (*)This information, including any data, is sourced from Unicorn Data Services SAS, trading as EOD Historical Data (“EODHD”) on an ‘as is’ basis, using their API. We cannot guarantee the completeness or validity of the information and data provided on this page, as well as via the API. In some cases, the data may include analyst ratings or recommendations sourced through the EODHD API, which are intended solely for general information purposes.
This information does not consider your personal objectives, financial situation, or needs. Kalkine is not liable for any errors or omissions in the information provided or for any actions taken in reliance on it. You should seek advice from a financial adviser, stockbroker or other professional adviser (including taxation and legal advice) as necessary before acting on this information.

Download a free report with stock ideas and industry insights for general information.
Download Free Report Now →


Basic Materials
 +1.50%
Communication Services
+0.38%

Consumer Cyclical
+0.82%

Consumer Defensive
+0.23%

Energy
+0.46%

Financial Services
+0.59%
Financials
 -0.27%

Healthcare
+1.07%

Industrials
+1.30%

Real Estate
+0.38%

Technology
+1.53%

Utilities
+0.38%
Note: Daily price change (%) by sector excluding stocks with +/-90% daily price change. Companies above $500 million market capitalization are considered.
 Portfolio
 Watchlist


 Please wait processing your request...