 CA
 NZ
 UK
 AU
 IND

 US


…
Belden Inc. provides connection solutions to bring data infrastructure into alignment to unlock new possibilities for its customers. The company provides copper cable and connectivity solutions, fiber cable and connectivity solutions, interconnect panels, racks and enclosures, and signal extension and matrix switching systems for use in local area networks, data centers, access control, 5G, fiber to the home, and building automation applications. It also provides power, cooling, and airflow management products for mission-critical data center operations; and end-to-end fiber and copper network systems. It also serves commercial real estate, education, financial institutions, stadiums and venues, military installations, and broadband and wireless service providers, as well as data centers, government, healthcare, and hospitality sectors. In addition, the company offers network digitization and automation solutions; and products and solutions covering various aspects of data handling, including acquisition, transmission, orchestration, and management for applications in discrete automation, process automation, energy, and mass transit. It sells its products to distributors, end-users, installers, and original equipment manufacturers (OEMs). It operates in the Americas, Europe, the Middle East, Africa, and the Asia-Pacific. The company was formerly known as Belden CDT Inc. and changed its name to Belden Inc. in May 2007. Belden Inc. was founded in 1902 and is headquartered in Saint Louis, Missouri.
Source: TradingView
The charts and visual representations are sourced from TradingView through embedded widgets. For any issues with chart display, please visit the TradingView website
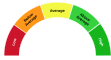
A unique technical analysis driven score developed by Kalkine showing momentum in stock prices based on select technical indicators identified.
Belden Inc designs, manufactures and sells signal transmission products including cables, connectivity and networking equipment for industrial, enterprise and broadcast markets worldwide. Long-term growth may be supported by rising data bandwidth needs, industrial automation, migration to Ethernet and fiber technologies, and targeted portfolio additions. Investors may find the company attractive because it appears positioned with diversified end markets, a specialist product mix and recurring demand tied to infrastructure and industrial modernization projects.
Key risks include sensitivity to cyclical industrial and enterprise capital spending, raw-material and logistics cost volatility, competitive pressure from larger network and cable suppliers and execution risk around acquisition integration and international operations.

Note: The summary and risk score provided above is created by AI and should not be construed as a recommendation of Kalkine.


| Breakdown | 2025-12-31 | 2024-12-31 | 2023-12-31 | 2022-12-31 | 2021-12-31 |
|---|---|---|---|---|---|
| Type | yearly | yearly | yearly | yearly | yearly |
| Date | 2025-12-31 | 2024-12-31 | 2023-12-31 | 2022-12-31 | 2021-12-31 |
| Income before tax | 266.87M | 227.94M | 285.76M | 317.39M | 87.66M |
| Minority interest | 0.00M | 0.02M | 0.20M | -0.16M | -0.39M |
| Net income | 237.52M | 198.43M | 242.76M | 254.66M | 63.92M |
| Selling general administrative | 526.82M | 494.60M | 496.18M | 448.64M | 426.33M |
| Gross profit | 1031.17M | 922.22M | 954.97M | 916.29M | 854.36M |
| Reconciled depreciation | 129.43M | 115.74M | 96.98M | 88.74M | 87.99M |
| Ebit | 313.30M | 266.25M | 319.38M | 363.33M | 296.53M |
| Ebitda | 442.73M | 381.99M | 418.83M | 418.19M | 384.52M |
| Depreciation and amortization | 129.43M | 115.74M | 99.45M | 54.85M | 87.99M |
| Non operating income net other | - | - | - | -6.39M | -5.71M |
| Operating income | 315.69M | 266.46M | 317.52M | 363.33M | 296.53M |
| Other operating expenses | 2399.50M | 2194.52M | 2194.57M | 2281.04M | 2143.08M |
| Interest expense | 46.35M | 38.30M | 33.62M | 43.55M | 62.70M |
| Tax provision | 29.34M | 29.53M | 56.02M | 49.65M | 25.20M |
| Interest income | 46.35M | 38.30M | 33.62M | 43.55M | 62.70M |
| Net interest income | -46.35M | -38.30M | -33.58M | -43.55M | -62.70M |
| Extraordinary items | - | 0.00M | 0.00M | -12.93M | 1.86M |
| Non recurring | - | - | - | - | 113.42M |
| Income tax expense | 29.34M | 29.53M | 43.20M | 49.65M | 25.20M |
| Total revenue | 2715.19M | 2460.98M | 2512.08M | 2606.49M | 2408.10M |
| Total operating expenses | 715.48M | 655.76M | 637.45M | 590.85M | 589.34M |
| Cost of revenue | 1684.02M | 1538.76M | 1557.12M | 1690.20M | 1553.74M |
| Total other income expense net | -48.83M | -38.52M | -31.76M | -45.94M | -208.87M |
| Discontinued operations | - | - | - | -3.69M | 1.86M |
| Net income from continuing ops | 237.52M | 198.41M | 265.37M | 267.75M | 62.46M |
| Net income applicable to common shares | 237.52M | 198.43M | 242.76M | 254.66M | 63.92M |
| Breakdown | 2025-12-31 | 2024-12-31 | 2023-12-31 | 2022-12-31 | 2021-12-31 |
|---|---|---|---|---|---|
| Type | yearly | yearly | yearly | yearly | yearly |
| Date | 2025-12-31 | 2024-12-31 | 2023-12-31 | 2022-12-31 | 2021-12-31 |
| Total assets | 3543.62M | 3327.94M | 3240.19M | 3161.68M | 3417.68M |
| Intangible assets | 399.80M | 419.07M | 269.14M | 246.83M | 301.70M |
| Other current assets | 94.30M | 73.12M | 79.14M | 66.87M | 65.70M |
| Total liab | 2279.20M | 2033.20M | 2073.89M | 2017.72M | 2461.59M |
| Total stockholder equity | 1264.42M | 1294.74M | 1166.26M | 1143.01M | 955.29M |
| Deferred long term liab | - | - | - | 58.58M | 59.99M |
| Other current liab | 336.07M | 256.11M | 247.63M | 246.81M | 255.05M |
| Common stock | 0.50M | 0.50M | 0.50M | 0.50M | 0.50M |
| Capital stock | 0.50M | 0.50M | 0.50M | 0.50M | 0.50M |
| Retained earnings | 1405.57M | 1176.04M | 985.81M | 751.52M | 505.72M |
| Other liab | - | - | - | 151.45M | 215.84M |
| Good will | 1036.82M | 1018.68M | 907.33M | 862.25M | 1152.47M |
| Other assets | 69.02M | 0.00M | 0.00M | 61.15M | 67.20M |
| Cash | 389.89M | 370.30M | 597.04M | 687.68M | 643.76M |
| Cash and equivalents | 389.89M | 370.30M | - | 687.68M | 643.76M |
| Total current liabilities | 697.50M | 622.70M | 633.50M | 639.92M | 718.54M |
| Current deferred revenue | - | 29.78M | 23.72M | 26.21M | 60.95M |
| Net debt | 1084.52M | 880.93M | 701.05M | 549.58M | 883.46M |
| Short term debt | 0.00M | 21.09M | 18.95M | 16.83M | 18.32M |
| Short long term debt total | 1474.41M | 1251.23M | 1298.10M | 1237.26M | 1527.22M |
| Other stockholder equity | -44.45M | 121.73M | 221.23M | 396.86M | 519.63M |
| Property plant equipment | 688.60M | 624.11M | - | 455.24M | 429.28M |
| Total current assets | 1349.38M | 1196.23M | 1456.98M | 1536.21M | 1467.03M |
| Net tangible assets | - | - | - | 93.18M | -498.88M |
| Net receivables | 462.85M | 409.71M | 413.81M | 440.10M | 412.22M |
| Long term debt | 1285.67M | 1130.10M | 1204.21M | 1161.18M | 1459.99M |
| Inventory | 402.35M | 343.10M | 366.99M | 341.56M | 345.35M |
| Accounts payable | 361.43M | 315.72M | 343.21M | 350.06M | 384.22M |
| Noncontrolling interest in consolidated entity | - | - | - | 0.94M | 0.80M |
| Accumulated other comprehensive income | -97.20M | -3.53M | -41.28M | -5.87M | -70.57M |
| Common stock total equity | - | - | - | 0.50M | 0.50M |
| Retained earnings total equity | - | - | - | 751.52M | 505.72M |
| Treasury stock | - | - | - | - | -313.99M |
| Non currrent assets other | 64.06M | 63.43M | 45.03M | 46.50M | 34.88M |
| Non current assets total | 2194.24M | 2131.71M | 1783.21M | 1625.47M | 1950.65M |
| Capital lease obligations | 116.52M | 121.13M | 93.89M | 59.25M | 67.22M |
| Long term debt total | 1293.58M | 1138.95M | - | 1161.18M | 1459.99M |
| Breakdown | 2025-12-31 | 2024-12-31 | 2023-12-31 | 2022-12-31 | 2021-12-31 |
|---|---|---|---|---|---|
| Type | yearly | yearly | yearly | yearly | yearly |
| Date | 2025-12-31 | 2024-12-31 | 2023-12-31 | 2022-12-31 | 2021-12-31 |
| Investments | - | -426.75M | -200.46M | 168.41M | -92.00M |
| Change to liabilities | - | - | - | -28.65M | 135.67M |
| Total cashflows from investing activities | -128.24M | -426.75M | -200.36M | 168.41M | -92.00M |
| Net borrowings | -1.83M | -1.13M | -0.42M | -230.64M | -7.45M |
| Total cash from financing activities | -217.77M | -143.72M | -211.93M | -393.21M | -32.93M |
| Change to operating activities | - | - | - | -7.51M | 27.91M |
| Net income | 237.52M | 198.41M | 242.76M | 254.82M | 64.32M |
| Change in cash | 19.59M | -226.74M | -90.63M | 43.92M | 141.76M |
| Begin period cash flow | 370.30M | 597.04M | 687.68M | 643.76M | 501.99M |
| End period cash flow | 389.89M | 370.30M | 597.04M | 687.68M | 643.76M |
| Total cash from operating activities | 354.86M | 352.08M | 319.64M | 281.30M | 272.06M |
| Issuance of capital stock | 11.63M | 8.92M | 6.57M | 3.72M | - |
| Depreciation | 129.43M | 115.74M | 99.45M | 88.74M | 87.99M |
| Other cashflows from investing activities | 0.19M | -1.20M | 13.79M | 273.50M | 2.63M |
| Dividends paid | 7.97M | 8.20M | 8.50M | 8.95M | 9.06M |
| Change to inventory | -48.23M | 24.32M | -15.33M | 5.56M | -92.98M |
| Change to account receivables | -37.77M | 18.86M | 24.53M | -33.60M | -91.11M |
| Sale purchase of stock | -216.40M | -134.31M | -192.13M | -150.00M | 0.00M |
| Other cashflows from financing activities | 8.43M | -9.00M | -17.44M | -7.19M | 339.58M |
| Change to netincome | - | - | - | -8.45M | 175.01M |
| Capital expenditures | 136.17M | 129.10M | 116.73M | 105.09M | 94.63M |
| Change receivables | - | - | - | -33.60M | -119.01M |
| Cash flows other operating | - | - | - | 2.88M | -12.69M |
| Cash and cash equivalents changes | - | - | - | 56.49M | 147.13M |
| Change in working capital | -57.50M | 26.34M | -18.38M | -53.81M | -54.87M |
| Stock based compensation | 30.02M | 27.53M | 21.02M | 23.68M | 24.87M |
| Other non cash items | 10.36M | 19.07M | -12.26M | -31.50M | 146.18M |
| Free cash flow | 218.69M | 222.98M | 202.91M | 176.20M | 177.42M |
Sector: Technology Industry: Communication Equipment
|
Stock Name
|
Change
(USD) |
Price
(USD) |
Trailing
PE (x) |
Forward
PE (x) |
Price Sales
TTM (x) |
Price to Book Value (x)
|
Enterprise Value
to Revenue (x) |
Enterprise Value
to EBITDA (x) |
|---|---|---|---|---|---|---|---|---|
| BDC Belden Inc |
-1.78 1.66% |
105.70 | 22.33 | 15.70 | 1.90 | 4.06 | 2.26 | 13.88 |
| CSCO Cisco Systems Inc |
-4.08 3.76% |
104.51 | 31.58 | 19.42 | 6.00 | 7.42 | 6.24 | 21.68 |
| LITE Lumentum Holdings Inc |
-78.83 8.57% |
840.70 | - | 38.31 | 24.97 | 16.13 | 24.50 | 114.87 |
| HPE Hewlett Packard Enterprise Co |
-3.78 6.42% |
55.09 | 28.51 | 12.20 | 1.77 | 2.80 | 2.11 | 13.02 |
| CIEN Ciena Corp |
-28.73 8.22% |
320.72 | 322.25 | 111.11 | 13.97 | 25.62 | 14.02 | 141.08 |
Belden Inc. provides connection solutions to bring data infrastructure into alignment to unlock new possibilities for its customers. The company provides copper cable and connectivity solutions, fiber cable and connectivity solutions, interconnect panels, racks and enclosures, and signal extension and matrix switching systems for use in local area networks, data centers, access control, 5G, fiber to the home, and building automation applications. It also provides power, cooling, and airflow management products for mission-critical data center operations; and end-to-end fiber and copper network systems. It also serves commercial real estate, education, financial institutions, stadiums and venues, military installations, and broadband and wireless service providers, as well as data centers, government, healthcare, and hospitality sectors. In addition, the company offers network digitization and automation solutions; and products and solutions covering various aspects of data handling, including acquisition, transmission, orchestration, and management for applications in discrete automation, process automation, energy, and mass transit. It sells its products to distributors, end-users, installers, and original equipment manufacturers (OEMs). It operates in the Americas, Europe, the Middle East, Africa, and the Asia-Pacific. The company was formerly known as Belden CDT Inc. and changed its name to Belden Inc. in May 2007. Belden Inc. was founded in 1902 and is headquartered in Saint Louis, Missouri.

1 North Brentwood Boulevard, Saint Louis, MO, United States, 63105

314 854 8000

8000
| Name | Title | Year Born |
|---|---|---|
| Mr. Roel Vestjens | Pres, CEO & Director | 1975 |
| Mr. Jeremy E. Parks | Sr. VP of Fin. & CFO | 1976 |
| Mr. Brian Edward Anderson | Sr. VP of Legal, Gen. Counsel & Corp. Sec. | 1975 |
| Mr. Ashish Chand | Exec. VP of Industrial Automation | 1975 |
| Mr. Anshuman Mehrotra | Exec. VP of Broadband & 5G | 1971 |
| Mr. Douglas R. Zink | VP & Chief Accounting Officer | 1976 |
| Mr. Kevin Richard Maczka | VP, Treasurer & Investor Relations | NA |
| Leah Tate | Sr. VP of HR | NA |
| Mr. Leo J. Kulmaczewski | Sr. VP of Operations & Lean Enterprise | 1966 |
| Mr. Hiran Bhadra | Sr. VP of Strategy | NA |
Disclaimer - (*)This information, including any data, is sourced from Unicorn Data Services SAS, trading as EOD Historical Data (“EODHD”) on an ‘as is’ basis, using their API. We cannot guarantee the completeness or validity of the information and data provided on this page, as well as via the API. In some cases, the data may include analyst ratings or recommendations sourced through the EODHD API, which are intended solely for general information purposes.
This information does not consider your personal objectives, financial situation, or needs. Kalkine is not liable for any errors or omissions in the information provided or for any actions taken in reliance on it. You should seek advice from a financial adviser, stockbroker or other professional adviser (including taxation and legal advice) as necessary before acting on this information.

Download a free report with stock ideas and industry insights for general information.
Download Free Report Now →


Basic Materials
 -1.82%
Communication Services
-0.22%

Consumer Cyclical
-0.13%

Consumer Defensive
 +0.32%

Energy
+0.15%

Financial Services
-0.85%
Financials
+2.34%

Healthcare
-1.28%

Industrials
-0.96%

Real Estate
-0.38%

Technology
-2.73%

Utilities
-0.31%
Note: Daily price change (%) by sector excluding stocks with +/-90% daily price change. Companies above $500 million market capitalization are considered.
 Portfolio
 Watchlist


 Please wait processing your request...