 CA
 NZ
 UK
 AU
 IND

 US


…
Weatherford International plc, an energy services company, provides equipment and services for the drilling, evaluation, completion, production, and intervention of oil, geothermal, and natural gas wells worldwide. The company operates through three segments: Drilling and Evaluation; Well Construction and Completions; and Production and Intervention. It offers artificial lift systems, including reciprocating rod, progressing cavity pumping, gas, hydraulic, plunger, and hybrid lift systems, as well as related automation and control systems; pressure pumping and reservoir stimulation services, such as acidizing, fracturing, cementing, and coiled-tubing intervention; and software, automation and flow measurement solutions. The company also provides safety, downhole reservoir monitoring, flow control, and multistage fracturing systems, as well as sand-control technologies, and production and isolation packers; liner hangers to suspend a casing string in high-temperature and high-pressure wells; cementing products, including plugs, float and stage equipment, and torque-and-drag reduction technology for zonal isolation; and pre-job planning and installation services. In addition, it offers directional drilling services, and logging and measurement services while drilling; services related to rotary-steerable systems, high temperature and high pressure sensors, drilling reamers, and circulation subs; rotating control devices and advanced automated control systems, as well as closed loop drilling, air drilling, managed-pressure drilling, and underbalanced drilling services; open-hole and cased-hole logging services; and intervention and remediation services. Further, it provides tubular handling, management, and connection services; and re-entry, fishing, and well abandonment services, as well as patented bottom hole, tubular-handling equipment, pressure-control equipment, and drill pipe and collars. The company was incorporated in 1972 and is based in Houston, Texas.
Source: TradingView
The charts and visual representations are sourced from TradingView through embedded widgets. For any issues with chart display, please visit the TradingView website
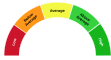
A unique technical analysis driven score developed by Kalkine showing momentum in stock prices based on select technical indicators identified.
Weatherford International plc provides equipment and services for drilling, evaluation, completion and production to oil and gas operators worldwide. Long-term growth may be supported by recovery in global oil and gas capital spending and by demand for completion and production optimization and digital efficiency services. Investors may find it attractive for its broad service portfolio, international footprint and steps to streamline operations after restructuring.
Primary risks are sensitivity to oil and gas commodity prices and capital spending cycles, intense competition and execution and regulatory challenges across multiple jurisdictions.

Note: The summary and risk score provided above is created by AI and should not be construed as a recommendation of Kalkine.


| Breakdown | 2022-12-31 | 2021-12-31 | 2020-12-31 | 2019-12-31 | 2018-12-31 |
|---|---|---|---|---|---|
| Type | yearly | yearly | yearly | yearly | yearly |
| Date | 2022-12-31 | 2021-12-31 | 2020-12-31 | 2019-12-31 | 2018-12-31 |
| Income before tax | 138.00M | -343.00M | -1814.00M | 3819.00M | -2757.00M |
| Minority interest | 25.00M | 21.00M | 30.00M | 36.00M | 39.00M |
| Net income | 51.00M | -429.00M | -1899.00M | 3661.00M | -2811.00M |
| Selling general administrative | 778.00M | -62.00M | 837.00M | 130.00M | 130.00M |
| Selling and marketing expenses | - | 800.00M | - | 765.00M | 764.00M |
| Gross profit | 1311.00M | 929.00M | 878.00M | 1101.00M | 1230.00M |
| Reconciled depreciation | 349.00M | 440.00M | 503.00M | 447.00M | 556.00M |
| Ebit | 317.00M | -83.00M | -1548.00M | -46.00M | -677.00M |
| Ebitda | 666.00M | 357.00M | -1045.00M | 401.00M | -121.00M |
| Depreciation and amortization | 349.00M | 440.00M | 503.00M | 447.00M | 556.00M |
| Non operating income net other | -95.00M | -199.00M | - | - | - |
| Operating income | 317.00M | -83.00M | -1548.00M | -46.00M | -2084.00M |
| Other operating expenses | 3897.00M | -328.00M | 3741.00M | 4884.00M | 368.00M |
| Interest expense | 179.00M | 260.00M | 266.00M | 362.00M | 614.00M |
| Tax provision | 87.00M | 86.00M | 85.00M | 135.00M | 34.00M |
| Net interest income | -179.00M | -260.00M | -266.00M | -362.00M | -648.00M |
| Non recurring | 31.00M | -10.00M | - | - | - |
| Income tax expense | 87.00M | 86.00M | 85.00M | 135.00M | 34.00M |
| Total revenue | 4331.00M | 3645.00M | 3685.00M | 4954.00M | 5744.00M |
| Total operating expenses | 877.00M | -328.00M | 934.00M | 1031.00M | 368.00M |
| Cost of revenue | 3020.00M | 2716.00M | 2807.00M | 3853.00M | 4514.00M |
| Total other income expense net | -179.00M | -260.00M | -266.00M | 3865.00M | -2068.00M |
| Net income from continuing ops | 51.00M | -429.00M | -1899.00M | 3684.00M | -2791.00M |
| Net income applicable to common shares | 26.00M | -450.00M | -1921.00M | 3635.00M | -2811.00M |
| Breakdown | 2023-12-31 | 2022-12-31 | 2021-12-31 | 2020-12-31 | 2019-12-31 |
|---|---|---|---|---|---|
| Type | yearly | yearly | yearly | yearly | yearly |
| Date | 2023-12-31 | 2022-12-31 | 2021-12-31 | 2020-12-31 | 2019-12-31 |
| Total assets | 5068.00M | 4720.00M | 4774.00M | 5434.00M | 7293.00M |
| Intangible assets | 370.00M | 506.00M | 657.00M | 810.00M | 1114.00M |
| Other current assets | 278.00M | 253.00M | 303.00M | 349.00M | 440.00M |
| Total liab | 4146.00M | 4169.00M | 4278.00M | 4497.00M | 4377.00M |
| Total stockholder equity | 924.00M | 551.00M | 496.00M | 937.00M | 2916.00M |
| Other current liab | 448.00M | 921.00M | 398.00M | 471.00M | 599.00M |
| Capital stock | 0.00M | 0.00M | 0.00M | 0.00M | 0.00M |
| Retained earnings | -1954.00M | -2371.00M | -2397.00M | -1947.00M | -26.00M |
| Other liab | - | 379.00M | 402.00M | 357.00M | 341.00M |
| Good will | - | - | - | 0.00M | 239.00M |
| Other assets | - | 138.00M | 97.00M | 73.00M | 109.00M |
| Cash | 958.00M | 910.00M | 951.00M | 1118.00M | 618.00M |
| Total current liabilities | 1866.00M | 1470.00M | 1332.00M | 1362.00M | 1672.00M |
| Current deferred revenue | 525.00M | - | 483.00M | 482.00M | 475.00M |
| Net debt | 1102.00M | 1499.00M | 1664.00M | 1744.00M | 1546.00M |
| Short term debt | 214.00M | 89.00M | 71.00M | 84.00M | 13.00M |
| Short long term debt | 151.00M | 31.00M | - | 4.00M | 13.00M |
| Short long term debt total | 2060.00M | 2409.00M | 2615.00M | 2862.00M | 2164.00M |
| Other stockholder equity | 2906.00M | 2944.00M | 2928.00M | 2927.00M | 2933.00M |
| Property plant equipment | - | 918.00M | 996.00M | 1374.00M | 2378.00M |
| Total current assets | 3345.00M | 3043.00M | 2911.00M | 3177.00M | 3453.00M |
| Net tangible assets | - | 29.00M | -185.00M | 97.00M | 1527.00M |
| Net receivables | 1216.00M | 989.00M | 825.00M | 826.00M | 1241.00M |
| Long term debt | 1679.00M | 2162.00M | 2372.00M | 2553.00M | 2151.00M |
| Inventory | 788.00M | 689.00M | 670.00M | 717.00M | 972.00M |
| Accounts payable | 679.00M | 460.00M | 380.00M | 325.00M | 585.00M |
| Noncontrolling interest in consolidated entity | - | 16.00M | 24.00M | - | - |
| Accumulated other comprehensive income | -28.00M | -22.00M | -35.00M | -43.00M | 9.00M |
| Retained earnings total equity | - | -2371.00M | -2397.00M | - | - |
| Non currrent assets other | 258.00M | 253.00M | 210.00M | 211.00M | 365.00M |
| Non current assets total | 1723.00M | 1677.00M | 1863.00M | 2257.00M | 3840.00M |
| Capital lease obligations | 230.00M | 216.00M | 243.00M | 305.00M | - |
| Long term debt total | - | 2203.00M | 2416.00M | - | - |
| Breakdown | 2022-12-31 | 2021-12-31 | 2020-12-31 | 2019-12-31 | 2018-12-31 |
|---|---|---|---|---|---|
| Type | yearly | yearly | yearly | yearly | yearly |
| Date | 2022-12-31 | 2021-12-31 | 2020-12-31 | 2019-12-31 | 2018-12-31 |
| Investments | -54.00M | -83.00M | 50.00M | 50.00M | 50.00M |
| Change to liabilities | 84.00M | 56.00M | -250.00M | -151.00M | -90.00M |
| Total cashflows from investing activities | -54.00M | -83.00M | -75.00M | 135.00M | 118.00M |
| Net borrowings | -203.00M | -375.00M | 417.00M | 933.00M | 242.00M |
| Total cash from financing activities | -248.00M | -403.00M | 348.00M | 749.00M | 168.00M |
| Change to operating activities | 80.00M | 54.00M | 96.00M | 65.00M | -111.00M |
| Net income | 51.00M | -429.00M | -1899.00M | 3684.00M | -2791.00M |
| Change in cash | -1.00M | -172.00M | 485.00M | 152.00M | -11.00M |
| Begin period cash flow | 1113.00M | 1285.00M | 800.00M | 602.00M | 613.00M |
| End period cash flow | 1112.00M | 1113.00M | 1285.00M | 754.00M | 602.00M |
| Total cash from operating activities | 349.00M | 322.00M | 210.00M | -747.00M | -242.00M |
| Issuance of capital stock | - | - | - | - | 0.00M |
| Depreciation | 349.00M | 440.00M | 503.00M | 447.00M | 556.00M |
| Other cashflows from investing activities | 78.00M | 2.00M | -4.00M | -14.00M | -14.00M |
| Dividends paid | -30.00M | 27.00M | 28.00M | - | - |
| Change to inventory | -56.00M | -18.00M | 64.00M | -215.00M | 86.00M |
| Change to account receivables | -193.00M | -6.00M | 378.00M | -135.00M | -70.00M |
| Other cashflows from financing activities | -20.00M | 1910.00M | 357.00M | 2943.00M | 670.00M |
| Change to netincome | 29.00M | 55.00M | 1340.00M | -4445.00M | 2198.00M |
| Capital expenditures | 132.00M | 85.00M | 154.00M | 250.00M | 214.00M |
| Change receivables | -193.00M | -6.00M | - | - | - |
| Cash flows other operating | 85.00M | 224.00M | - | - | - |
| Exchange rate changes | - | -8.00M | - | - | - |
| Cash and cash equivalents changes | 47.00M | -172.00M | - | - | - |
| Change in working capital | -165.00M | 32.00M | 192.00M | -433.00M | -190.00M |
| Stock based compensation | 25.00M | 25.00M | 820.00M | 46.00M | 47.00M |
| Other non cash items | 85.00M | 264.00M | 599.00M | -4516.00M | 2215.00M |
| Free cash flow | 217.00M | 237.00M | 56.00M | -997.00M | -456.00M |
Sector: Energy Industry: Oil & Gas Equipment & Services
|
Stock Name
|
Change
(USD) |
Price
(USD) |
Trailing
PE (x) |
Forward
PE (x) |
Price Sales
TTM (x) |
Price to Book Value (x)
|
Enterprise Value
to Revenue (x) |
Enterprise Value
to EBITDA (x) |
|---|---|---|---|---|---|---|---|---|
| WFRD Weatherford International plc |
1.05 1.17% |
90.63 | 18.57 | 14.04 | 1.66 | 9.21 | 1.87 | 9.47 |
| SLB Schlumberger NV |
-0.07 0.13% |
53.74 | 26.44 | 16.31 | 2.21 | 3.04 | 2.42 | 13.18 |
| BKR Baker Hughes Co |
0.72 1.32% |
55.23 | 18.24 | 17.57 | 2.03 | 2.83 | 2.05 | 11.20 |
| HAL Halliburton Company |
0.27 0.75% |
36.17 | 18.29 | 12.12 | 1.33 | 2.65 | 1.58 | 9.83 |
| FTI TechnipFMC PLC |
1.82 2.72% |
68.77 | 25.50 | 21.74 | 2.82 | 8.73 | 2.77 | 14.51 |
Weatherford International plc, an energy services company, provides equipment and services for the drilling, evaluation, completion, production, and intervention of oil, geothermal, and natural gas wells worldwide. The company operates through three segments: Drilling and Evaluation; Well Construction and Completions; and Production and Intervention. It offers artificial lift systems, including reciprocating rod, progressing cavity pumping, gas, hydraulic, plunger, and hybrid lift systems, as well as related automation and control systems; pressure pumping and reservoir stimulation services, such as acidizing, fracturing, cementing, and coiled-tubing intervention; and software, automation and flow measurement solutions. The company also provides safety, downhole reservoir monitoring, flow control, and multistage fracturing systems, as well as sand-control technologies, and production and isolation packers; liner hangers to suspend a casing string in high-temperature and high-pressure wells; cementing products, including plugs, float and stage equipment, and torque-and-drag reduction technology for zonal isolation; and pre-job planning and installation services. In addition, it offers directional drilling services, and logging and measurement services while drilling; services related to rotary-steerable systems, high temperature and high pressure sensors, drilling reamers, and circulation subs; rotating control devices and advanced automated control systems, as well as closed loop drilling, air drilling, managed-pressure drilling, and underbalanced drilling services; open-hole and cased-hole logging services; and intervention and remediation services. Further, it provides tubular handling, management, and connection services; and re-entry, fishing, and well abandonment services, as well as patented bottom hole, tubular-handling equipment, pressure-control equipment, and drill pipe and collars. The company was incorporated in 1972 and is based in Houston, Texas.

2000 St. James Place, Houston, TX, United States, 77056

713 836 4000

18800
| Name | Title | Year Born |
|---|---|---|
| Mr. Girishchandra K. Saligram | Pres, CEO & Director | 1972 |
| Mr. Desmond J. Mills | Sr. VP, Interim CFO & Chief Accounting Officer | 1973 |
| Mr. Scott C. Weatherholt | Exec. VP, Gen. Counsel & Chief Compliance Officer | 1978 |
| Mr. Joseph H. Mongrain | Exec. VP & Chief People Officer | 1959 |
| Dr. Bernard J. Duroc-Danner Ph.D. | Chairman Emeritus and External Advisor | 1954 |
| Sebastian Pellizzer | Sr. Director of Investor Relations | NA |
| Kelley Hughes | Director of Global Communications | NA |
| Ms. Natalia Shehadeh | VP & Chief Assurance Officer | NA |
| Mr. Charles W. Davison Jr. | Exec. VP of Operational Excellence | 1969 |
| Christine M. Morrison | VP, Deputy Gen. Counsel & Corp. Sec. | NA |
Disclaimer - (*)This information, including any data, is sourced from Unicorn Data Services SAS, trading as EOD Historical Data (“EODHD”) on an ‘as is’ basis, using their API. We cannot guarantee the completeness or validity of the information and data provided on this page, as well as via the API. In some cases, the data may include analyst ratings or recommendations sourced through the EODHD API, which are intended solely for general information purposes.
This information does not consider your personal objectives, financial situation, or needs. Kalkine is not liable for any errors or omissions in the information provided or for any actions taken in reliance on it. You should seek advice from a financial adviser, stockbroker or other professional adviser (including taxation and legal advice) as necessary before acting on this information.

Download a free report with stock ideas and industry insights for general information.
Download Free Report Now →


Basic Materials
 -1.82%
Communication Services
-0.22%

Consumer Cyclical
-0.13%

Consumer Defensive
 +0.32%

Energy
+0.15%

Financial Services
-0.85%
Financials
+2.34%

Healthcare
-1.28%

Industrials
-0.96%

Real Estate
-0.38%

Technology
-2.73%

Utilities
-0.31%
Note: Daily price change (%) by sector excluding stocks with +/-90% daily price change. Companies above $500 million market capitalization are considered.
 Portfolio
 Watchlist


 Please wait processing your request...