 CA
 NZ
 UK
 AU
 IND

 US


…
KO Gold Inc., an exploration company, engages in acquiring, exploring, and developing mineral properties in New Zealand. It primarily explores for gold deposits. The company holds 100% interests in the Otago Gold projects comprising two 100% owned prospecting permits and six 100% owned exploration permits covering an area of approximately 740 square kilometer; and the Smylers Gold project that comprise two exploration permits covering an area of approximately 62 square kilometer. The company was formerly known as OK Gold Inc. and changed its name to KO Gold Inc. in June 2020. KO Gold Inc. was incorporated in 2020 and is based in Toronto, Canada.
Source: TradingView
The charts and visual representations are sourced from TradingView through embedded widgets. For any issues with chart display, please visit the TradingView website
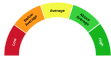
A unique technical analysis driven score developed by Kalkine showing momentum in stock prices based on select technical indicators identified.
KO Gold Inc. is a Canadian-listed mineral exploration company focused on identifying and advancing gold-bearing projects; publicly available detail on its specific assets and project stage is limited. Its long-term growth drivers include successful exploration results, resource definition, access to capital and favourable gold prices, which may benefit investors seeking leverage to metal price upside and discovery potential.
The primary investment risk is that exploration outcomes are uncertain and the company may require additional financing, leading to project delays and shareholder dilution.

Note: The summary and risk score provided above is created by AI and should not be construed as a recommendation of Kalkine.


| Breakdown | 2025-03-31 | 2024-03-31 | 2023-03-31 | 2022-03-31 | 2021-03-31 |
|---|---|---|---|---|---|
| Type | yearly | yearly | yearly | yearly | yearly |
| Date | 2025-03-31 | 2024-03-31 | 2023-03-31 | 2022-03-31 | 2021-03-31 |
| Income before tax | -1.37M | -2.45M | -0.53M | -0.97M | -0.22M |
| Net income | -1.37M | -2.45M | -0.53M | -0.97M | -0.22M |
| Selling general administrative | 0.76M | 0.91M | 0.26M | 0.08M | 0.05M |
| Operating income | -1.37M | -2.45M | -0.53M | -0.97M | -0.22M |
| Interest expense | 0.01M | - | - | - | - |
| Interest income | 0.00M | 0.00M | 0.00M | 0.00M | - |
| Total revenue | 0.00M | 0.00M | 0.00M | 0.00M | 0.00M |
| Net income applicable to common shares | -1.37M | -2.45M | -0.53M | -0.97M | -0.22M |
| Breakdown | 2025-03-31 | 2024-03-31 | 2023-03-31 | 2022-03-31 | 2021-03-31 |
|---|---|---|---|---|---|
| Type | yearly | yearly | yearly | yearly | yearly |
| Date | 2025-03-31 | 2024-03-31 | 2023-03-31 | 2022-03-31 | 2021-03-31 |
| Total assets | 0.28M | 0.86M | 0.56M | 0.05M | 0.14M |
| Total liab | 0.91M | 0.29M | 0.14M | 0.12M | 0.06M |
| Total stockholder equity | -0.63M | 0.58M | 0.41M | -0.07M | 0.08M |
| Common stock | 4.04M | 3.92M | 2.15M | 1.00M | 0.36M |
| Retained earnings | -5.17M | -3.80M | -1.77M | -1.08M | -0.28M |
| Cash | 0.24M | 0.78M | 0.51M | 0.01M | 0.11M |
| Total current liabilities | 0.91M | 0.29M | 0.14M | 0.12M | 0.06M |
| Short term debt | 0.22M | 0.02M | 0.00M | 0.00M | 0.00M |
| Other stockholder equity | -0.00M | -0.01M | 0.00M | 0.00M | 0.00M |
| Total current assets | 0.28M | 0.86M | 0.56M | 0.05M | 0.14M |
| Long term debt total | 0.00M | 0.00M | 0.00M | 0.00M | 0.00M |
| Breakdown | 2025-03-31 | 2024-03-31 | 2023-03-31 | 2022-03-31 | 2021-03-31 |
|---|---|---|---|---|---|
| Type | yearly | yearly | yearly | yearly | yearly |
| Date | 2025-03-31 | 2024-03-31 | 2023-03-31 | 2022-03-31 | 2021-03-31 |
| Total cash from financing activities | 0.27M | 1.05M | 0.86M | 0.82M | 0.30M |
| Net income | -1.37M | -2.45M | -0.53M | -0.97M | -0.22M |
| Change in cash | -0.54M | 0.27M | 0.50M | -0.10M | 0.11M |
| Total cash from operating activities | -0.82M | -0.77M | -0.36M | -0.92M | -0.19M |
| Sale purchase of stock | 0.07M | 1.11M | 0.90M | 0.82M | 0.30M |
| Other cashflows from financing activities | 0.00M | -0.08M | -0.03M | -0.00M | -0.00M |
| Capital expenditures | 0.00M | 0.00M | 0.00M | 0.00M | 0.00M |
| Change in working capital | 0.39M | 0.12M | 0.17M | 0.05M | 0.03M |
Sector: Basic Materials Industry: Gold
|
Stock Name
|
Change
(CAD) |
Price
(CAD) |
Trailing
PE (x) |
Forward
PE (x) |
Price Sales
TTM (x) |
Price to Book Value (x)
|
|---|---|---|---|---|---|---|
| KOG KO Gold Inc. |
0.02 17.39% |
0.14 | - | - | - | 22.13 |
| AGC Avanti Gold Corp. (formerly was VALU/Valorem Resources Inc. until 2023-04-20) |
- -% |
0.28 | - | - | - | 9.15 |
| AMQ Abitibi Metals Corp. |
-0.08 13.79% |
0.50 | - | - | - | 3.05 |
| NOM Norsemont Mining Inc |
-0.08 12.31% |
0.57 | - | - | 601.02 | 4.53 |
| SANU Sanu Gold Corp. |
0.01 2.94% |
0.17 | - | - | - | 4.76 |
KO Gold Inc., an exploration company, engages in acquiring, exploring, and developing mineral properties in New Zealand. It primarily explores for gold deposits. The company holds 100% interests in the Otago Gold projects comprising two 100% owned prospecting permits and six 100% owned exploration permits covering an area of approximately 740 square kilometer; and the Smylers Gold project that comprise two exploration permits covering an area of approximately 62 square kilometer. The company was formerly known as OK Gold Inc. and changed its name to KO Gold Inc. in June 2020. KO Gold Inc. was incorporated in 2020 and is based in Toronto, Canada.
| Name | Title | Year Born |
|---|---|---|
| Mr. Gregory Powell Isenor B.Sc., P.Geo. | President, CEO & Director | 1952 |
| Mr. Paul John Teniere M.Sc., P.Geo. | VP of Exploration & Director | 1976 |
| Mr. James A. Henning B.Comm., C.A., C.F.A., CPA, CBV | Chief Financial Officer | 1950 |
| Ms. Leah Dionne | Corporate Secretary | NA |
Disclaimer - (*)This information, including any data, is sourced from Unicorn Data Services SAS, trading as EOD Historical Data (“EODHD”) on an ‘as is’ basis, using their API. We cannot guarantee the completeness or validity of the information and data provided on this page, as well as via the API. In some cases, the data may include analyst ratings or recommendations sourced through the EODHD API, which are intended solely for general information purposes.
This information does not consider your personal objectives, financial situation, or needs. Kalkine is not liable for any errors or omissions in the information provided or for any actions taken in reliance on it. You should seek advice from a financial adviser, stockbroker or other professional adviser (including taxation and legal advice) as necessary before acting on this information.

Download a free report with stock ideas and industry insights for general information.
Download Free Report Now →


Basic Materials
 -0.44%
Communication Services
-0.67%

Consumer Cyclical
-0.51%

Consumer Defensive
-0.25%

Energy
-0.53%

Financial Services
-0.68%
Financials
-1.31%

Healthcare
-0.50%

Industrials
-0.60%

Real Estate
-0.34%

Technology
-1.10%

Utilities
-0.41%
Note: Daily price change (%) by sector excluding stocks with +/-90% daily price change. Companies above $500 million market capitalization are considered.
 Portfolio
 Watchlist


 +155.35%
 Please wait processing your request...