
 CA
 NZ
 UK
 AU
 IND

 US

 Share
 X (Formerly Twitter)
 Whatsapp
 Facebook
 LinkedIn
 Telegram
 Email This Article
 Copy Link
 Summarize with AI
 Chat GPT
 Perplexity

Today’s session highlights an acute structural divergence across the core infrastructure, electrification, and thermal-management leaders powering the generative artificial intelligence boom. After spearheading a multi-quarter secular advance from late 2025 into the spring of 2026, the artificial intelligence power-ecosystem basket has entered an expansive rotational and distribution test. Daily charts reveal a market bifurcated between names maintaining resilient structural momentum and those actively threatening multi-month breakdown floors.
Bloom Energy (NYSE: BE) stands out as the primary technical leader of the group, trading comfortably above its 21-day, 63-day, and 256-day exponential moving averages (EMAs) while asserting strong relative strength. In stark contrast, Vertiv Holdings (NYSE: VRT), GE Vernova (NYSE: GEV), Quanta Services (NYSE: PWR), and Eaton Corporation (NYSE: ETN) are struggling under corrective pressure. Vertiv has slipped directly beneath its long-term 256-day EMA anchor, placing it in immediate technical breakdown territory. Eaton, Quanta, and GE Vernova are all pinned beneath their declining short- and medium-term Moving Average clusters (21-day and 63-day EMAs), attempting to defend multi-month horizontal consolidation shelves as relative momentum indicators drift near the oversold threshold.
Bloom Energy Corporation (NYSE: BE) — Sole Bullish Outlier, Expanding Above the EMA Cluster
Key Highlights
- Price Action & Volume: BE is trading at $259.29, advancing +0.87% (+$2.24) on Volume of 9.36M shares, after moving between an intraday low of $257.09 and a high of $269.83.
- Moving Average Alignment: Price is trading firmly above its ascending 21-day EMA ($240.08), 63-day EMA ($234.70), and long-term 256-day EMA ($181.58), preserving a bullish golden-cross alignment.
- Momentum Oscillator: The 14-day RSI sits in positive expansion territory at 57.98, holding comfortably above its 55.96 signal line and well above the neutral 50.00 midpoint.
- Macro Trajectory: After launching from an August 2025 base near $50.00 to a July 2026 cycle high near $350.00, BE absorbed a sharp July–August corrective flush toward $160.00. It then mounted an aggressive V-shaped recovery throughout late August and September, reclaiming its short- and medium-term moving averages.
- Relative Performance: BE represents the only constituent in the AI power basket sustaining bullish structure above both its 21-day and 63-day EMAs.
Trend Structure
Bloom Energy's Daily Chart reflects an aggressive bull-market advance characterized by expanding volume on up-legs and a successful defense of primary trend boundaries. The severe mid-summer drawdown to $160.00 cleared late-cycle speculative froth, establishing an institutional Demand floor just above the rising 256-day EMA. The subsequent impulse move through late August cleared overhead resistance at $235.00, turning previous resistance into dynamic support. The current consolidation between $255.00 and $270.00 functions as a constructive high-handle formation following a major trend reversal. 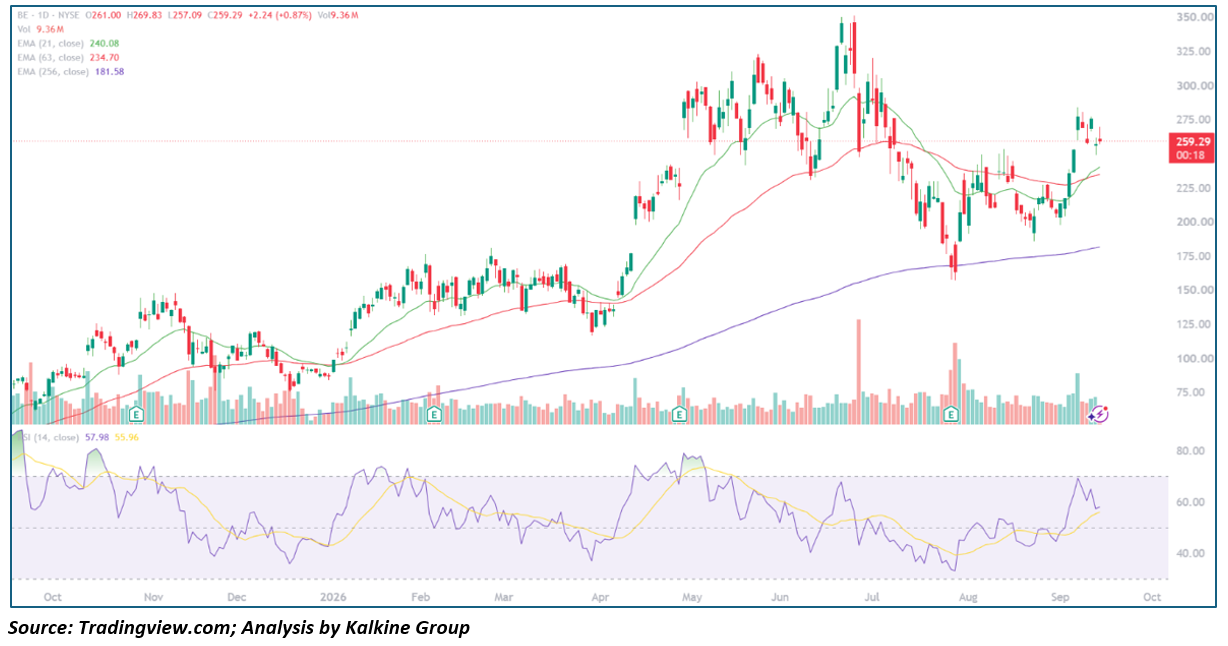
Key Technical Levels
- Resistance:
- $270.00–$275.00: September local consolidation highs and intraday rejection wick
- $300.00–$310.00: Key distribution Supply zone from June 2026
- $350.00: All-time cycle high recorded in July 2026
- Support:
- $240.08: Dynamic 21-day EMA
- $234.70: Dynamic 63-day EMA
- $181.58: Long-term 256-day EMA trend floor
Outlook
Bloom Energy remains the technical pacemaker of the AI power generation cohort. With price action consolidating above upward-sloping short-term EMAs and the RSI holding the upper half of its range, the setup favors upside continuation. A decisive daily close above $275.00 would clear overhead Liquidity and open an expansion path toward $300.00+. Conversely, a breakdown beneath the $234.00–$240.00 EMA support shelf would invalidate the near-term breakout structure and risk a corrective retest of the $200.00 psychological anchor.
Eaton Corporation plc (NYSE: ETN) — Compressing Toward Long-Term Trend Support
Key Highlights
- Price Action & Volume: ETN is trading at $392.24, slipping -0.23% (-$0.92) on volume of 1.75M shares, after oscillating between an intraday low of $389.40 and a high of $400.27.
- Moving Average Alignment: Price is pinned beneath both its declining 21-day EMA ($411.10) and 63-day EMA ($411.50), while hovering above its upward-sloping 256-day EMA ($381.99).
- Momentum Oscillator: The 14-day RSI registers at 41.89, tracking beneath its 44.91 signal line and drifting within a weak, sub-50 neutral-to-bearish regime.
- Macro Trajectory: ETN climbed steadily from late 2025 lows near $330.00 to an all-time peak above $475.00 in August 2026, before succumbing to a rapid sequence of lower highs and lower lows through late August and September.
- Relative Performance: Eaton exhibits an intermediate distribution pattern, with its 21-day and 63-day moving averages converging into a tight bearish knot overhead.
Trend Structure
Eaton’s daily chart illustrates a transition from an aggressive parabolic trend into a broad distribution top. The rapid rejection from the $475.00+ record peak in August breached short-term swing supports with notable downside momentum. Subsequent relief rallies have failed decisively beneath the $420.00 handle, converting former support into stubborn resistance. Price action is now compressing directly toward the long-term 256-day EMA ($381.99), which historically served as the primary bull-market trend guide throughout early 2026. 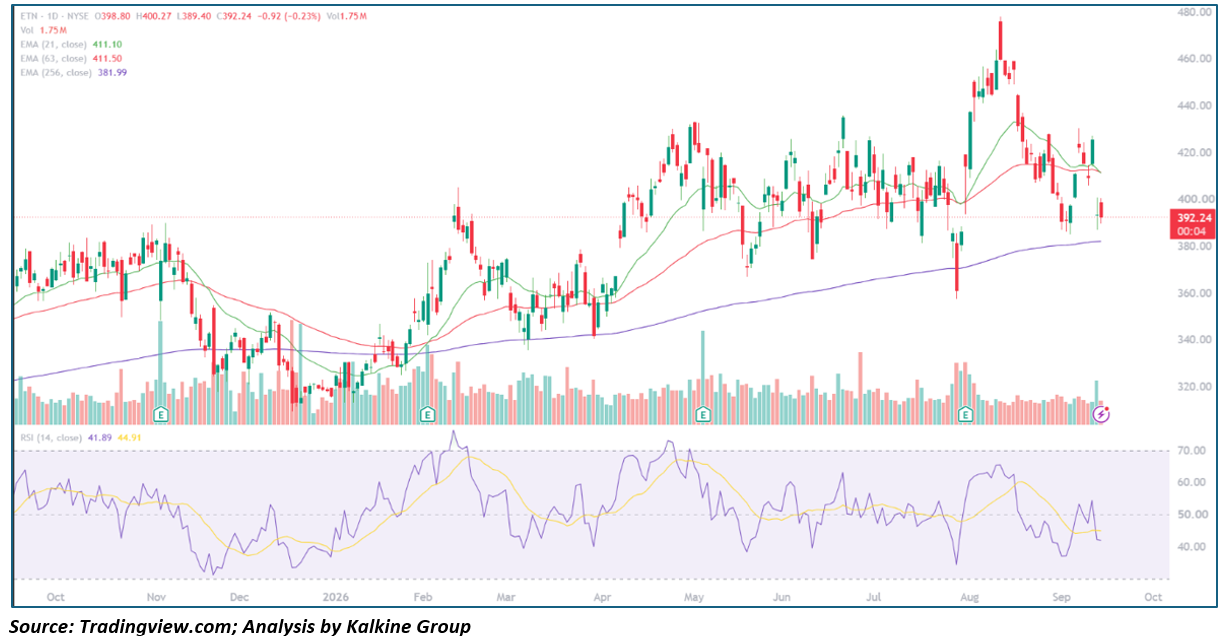
Key Technical Levels
- Resistance:
- $411.10–$411.50: Dynamic 21-day and 63-day EMA confluence
- $430.00–$435.00: Late-August breakdown pivot and horizontal supply shelf
- $475.00+: Cycle record high
- Support:
- $389.40: Session intraday low
- $381.99: Rising 256-day EMA structural boundary
- $360.00: Structural swing low established in late spring 2026
Outlook
Eaton sits at a critical technical crossroad. The ongoing failure to overcome the $411.00 EMA confluence keeps the short-term bias pointed lower. The immediate focus rests on whether dip-buyers can defend the $382.00–$389.00 pocket, where the session low meets the 256-day EMA. A confirmed breakdown beneath $381.99 would officially mark a macro trend break, exposing downside risk toward $360.00. To neutralize this bearish posture, bulls must force a high-volume daily close back above $412.00.
Quanta Services, Inc. (NYSE: PWR) — Bearish Flagging Beneath Moving Average Resistance
Key Highlights
- Price Action & Volume: PWR is trading at $612.43, falling -1.54% (-$9.59) on volume of 470.28K shares, moving between an intraday low of $609.50 and a peak of $626.50.
- Moving Average Alignment: Price is trading beneath its declining 21-day EMA ($631.77) and 63-day EMA ($647.49), while remaining supported above its rising 256-day EMA ($568.64).
- Momentum Oscillator: The 14-day RSI reads 43.94, resting just below its 44.12 signal line, reflecting persistent seller control and lack of upward velocity.
- Macro Trajectory: After rallying from an October 2025 base near $400.00 to a May 2026 all-time high near $780.00, PWR entered an expansive multi-month correction that dropped price to a summer low of $560.00.
- Relative Performance: A late-summer counter-trend recovery into the $720.00 region was met with heavy institutional selling, resulting in a lower-high rollover that has pushed the stock back below its medium-term EMAs.
Trend Structure
Quanta Services’ technical structure is characterized by a series of descending peaks since its May peak near $780.00. The sharp drop in late July was briefly arrested at the 256-day EMA ($560.00 area), but the subsequent August rebound stalled out well below prior highs near $720.00. Over the past two weeks, PWR has printed a bearish consolidation flag directly beneath the descending 21-day and 63-day EMAs. The inability of buyers to push price through the $640.00–$647.00 ceiling suggests that institutional distribution remains active on any intraday strength. 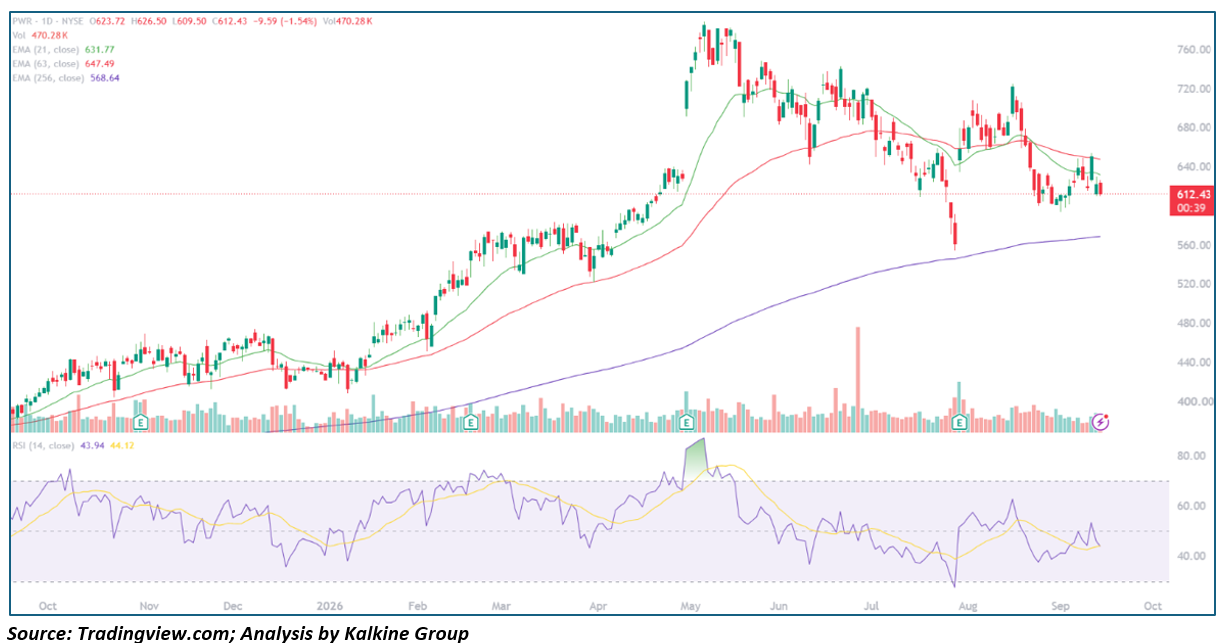
Key Technical Levels
- Resistance:
- $631.77: Dynamic 21-day EMA
- $647.49: Dynamic 63-day EMA
- $720.00: August lower-high structural resistance pivot
- Support:
- $609.50: Intraday session low
- $580.00: Intermediate horizontal demand shelf
- $568.64: Macro 256-day EMA dynamic trend floor
Outlook
PWR’s daily posture remains vulnerable to renewed selling pressure as long as it remains compressed below $632.00–$648.00. The consolidation above $610.00 appears fragile, and a clean breach of the $609.50 session low would likely trigger an accelerated test of the primary Trendline at the 256-day EMA ($568.64). A breakout and close above the 63-day EMA at $647.49 is strictly required to reverse the ongoing downtrend and reignite a push toward $700.00.
GE Vernova Inc. (NYSE: GEV) — Testing Multi-Month Range Lows After Moving Average Rejection
Key Highlights
- Price Action & Volume: GEV is trading at $881.89, up +0.82% (+$7.13) on volume of 1.72M shares, having fluctuated between a session trough of $875.24 and a high of $894.79.
- Moving Average Alignment: Price is trading well beneath its falling 21-day EMA ($943.34) and 63-day EMA ($978.50), but maintains a cushion above the 256-day EMA ($844.95).
- Momentum Oscillator: The 14-day RSI is pinned in deeply oversold territory at 38.96, drifting beneath its 41.97 signal line without generating a bullish divergence.
- Macro Trajectory: GEV mounted a powerful bull run from $500.00 in late 2025 to a May 2026 high of $1,220.00, consolidated in a volatile summer range between $900.00 and $1,200.00, and has recently broken down from that range to print fresh multi-month lows.
- Relative Performance: Despite today’s modest percentage gain, GEV remains one of the weaker structural charts in the group, having failed multiple recovery attempts at the $1,000.00 psychological level.
Trend Structure
The technical backdrop for GE Vernova depicts an advanced topping formation. The stock spent May through July executing a broad distribution range between $900.00 and $1,220.00. However, the breakdown in early September breached the critical $950.00 structural pivot, transforming former dynamic EMA support into strong overhead resistance. Today's minor green candle represents an oversold reaction bounce off the $875.00 level rather than a confirmed bottom. Volume continues to favor distribution days, while the RSI has failed to reclaim its neutral midline since late August. 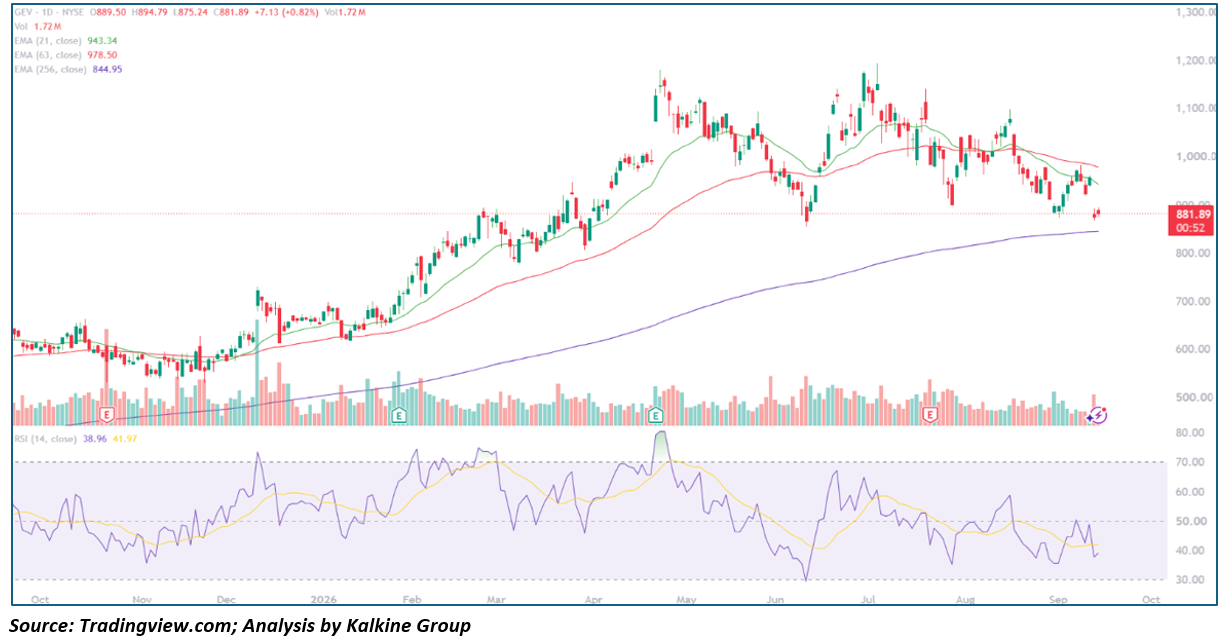
Key Technical Levels
- Resistance:
- $943.34: Dynamic 21-day EMA
- $978.50: Dynamic 63-day EMA
- $1,000.00–$1,020.00: Major psychological threshold and breakdown shelf
- Support:
- $875.24: Session intraday low
- $844.95: Rising 256-day EMA long-term support
- $800.00: Round-number psychological cushion
Outlook
While GEV is attempting to stabilize after tagging $875.24, the prevailing trend remains firmly bearish over the short to intermediate term. With the stock situated beneath both its 21-day and 63-day EMAs, upside bounces are likely to encounter aggressive supply near $940.00–$980.00. Continued weakness that breaks beneath $875.00 would open the door for a test of the 256-day EMA at $844.95. Only a high-volume recovery that reclaims $980.00 would suggest that a durable bottom has been established.
Vertiv Holdings Co (NYSE: VRT) — Breakdown Threat as Price Violates the 256-Day EMA
Key Highlights
- Price Action & Volume: VRT is trading at $234.67, declining -1.15% (-$2.72) on volume of 4.58M shares, having touched a session low of $233.91 and a high of $245.41.
- Moving Average Alignment: Price has decisively broken down below its 21-day EMA ($261.52) and 63-day EMA ($276.98), and is now undercutting its critical 256-day EMA ($243.40).
- Momentum Oscillator: The 14-day RSI is depressed at 38.19, tracking below its 45.30 signal line and approaching oversold parameters.
- Macro Trajectory: VRT enjoyed an exceptional multi-quarter rally from $140.00 in late 2025 to a May 2026 record high near $375.00, followed by a persistent unwind that has now erased the vast majority of its 2026 year-to-date gains.
- Relative Performance: Vertiv displays the weakest technical posture across the entire AI power and infrastructure complex, becoming the first major constituent to breach its 256-day EMA.
Trend Structure
Vertiv’s daily chart demonstrates severe structural damage. Following its May peak near $375.00, the stock entered an aggressive downtrend defined by lower highs and lower lows. A mid-summer bounce into $350.00 was aggressively sold off, culminating in a sharp collapse through the 63-day EMA in July. While buyers attempted to mount an August defense along the 256-day EMA near $240.00, recent sessions have witnessed renewed selling pressure that has driven price action directly beneath this long-term trend baseline. Today’s drop to $234.67 confirms that sellers have overwhelmed dynamic support, leaving the stock without immediate structural cushions above the late-summer troughs. 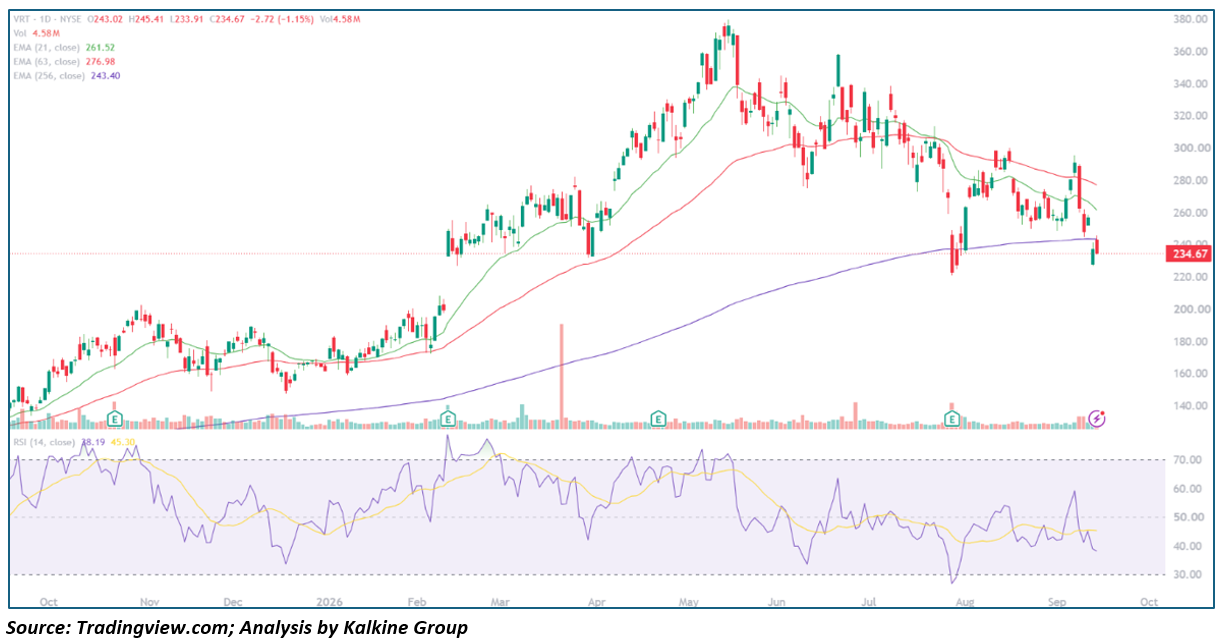
Key Technical Levels
- Resistance:
- $243.40: Broken 256-day EMA (now acting as dynamic resistance)
- $261.52: Dynamic 21-day EMA
- $276.98: Dynamic 63-day EMA
- Support:
- $233.91: Session intraday low
- $220.00–$225.00: August 2026 Capitulation low boundary
- $200.00: Major psychological demand floor
Outlook
Vertiv is in an active technical breakdown phase. The failure to hold the 256-day EMA at $243.40 shifts the macro chart from an orderly consolidation into an outright intermediate-term downtrend. Without an immediate and forceful daily reclaim back above $245.00, the path of least resistance points toward a full retest of the August capitulation lows at $220.00–$225.00, with risk extending down to $200.00 upon any subsequent liquidation. A recovery above $262.00 is required before any constructive bottoming thesis can be entertained.
Comparative Technical Summary: AI Power & Grid Infrastructure
The technical posture of the AI power and Data Center infrastructure group reveals pronounced internal dispersion. Investors and systematic strategies are differentiating between standalone power solutions exhibiting resilient relative strength and transmission/thermal suppliers undergoing cyclical re-evaluations:
|
Ticker |
Last Price |
Intraday Change |
21-Day EMA |
63-Day EMA |
256-Day EMA |
14-Day RSI |
Technical Classification |
|---|---|---|---|---|---|---|---|
|
BE |
$259.29 |
+0.87% |
$240.08 |
$234.70 |
$181.58 |
57.98 |
Bullish Breakout Continuation |
|
ETN |
$392.24 |
-0.23% |
$411.10 |
$411.50 |
$381.99 |
41.89 |
Neutral / Long-Term EMA Test |
|
PWR |
$612.43 |
-1.54% |
$631.77 |
$647.49 |
$568.64 |
43.94 |
Bearish Consolidation Flag |
|
GEV |
$881.89 |
+0.82% |
$943.34 |
$978.50 |
$844.95 |
38.96 |
Oversold Bounce in Downtrend |
|
VRT |
$234.67 |
-1.15% |
$261.52 |
$276.98 |
$243.40 |
38.19 |
Structural Technical Breakdown |
While Bloom Energy continues to trade in an independent bullish expansion regime supported by strong volume and favorable moving average geometry, the broader AI power ecosystem remains under technical liquidation. Eaton, Quanta, and GE Vernova are testing intermediate-to-long term support levels, requiring disciplined risk management until their overhead EMA resistance clusters are formally reclaimed. Meanwhile, Vertiv represents the cautionary signal for the broader complex, having broken below its primary 256-day moving average and warning of further downside vulnerability across extended infrastructure holdings.
This analysis is based on daily chart technical indicators (21/63/256-day EMAs, RSI-14) and price action as of September 15, 2026, and is intended strictly for educational and informational purposes — not individual Investment advice.


 Oct 30, 2026





 Please wait processing your request...