
 CA
 NZ
 UK
 AU
 IND

 US

 Share
 X (Formerly Twitter)
 Whatsapp
 Facebook
 LinkedIn
 Telegram
 Email This Article
 Copy Link
 Summarize with AI
 Chat GPT
 Perplexity

Today's session produced broad-based selling pressure across the primary nuclear energy, uranium fuel, and small modular reactor (SMR) pure-plays powering the hyperscale artificial intelligence buildout, with losses spanning -0.64% to over -2.10%. Following an aggressive, multi-quarter advance from late 2025 into early 2026 driven by data-center baseload power contracts, all four marquee names—Oklo Inc. (NYSE: OKLO), NuScale Power (NYSE: SMR), BWX Technologies (NYSE: BWXT), and Cameco Corp. (TSX: CCO)—are now trading beneath their descending 21-day and 63-day exponential moving averages (EMAs).
Cameco Corp. posted the sharpest percentage drop of the group, decisively breaking beneath its long-term 256-day EMA anchor. BWX Technologies and Oklo Inc. extended persistent multi-month downtrends to print fresh cycle lows well below their macro moving averages, while NuScale Power slipped back below its overhead EMA cluster following a failed early-September relief attempt. Across the board, the AI nuclear cohort remains firmly locked in "bearish distribution and breakdown" territory, with momentum indicators tracking sub-50 neutral lines and testing oversold boundaries.
Cameco Corporation (TSX: CCO) — Largest Percentage Decline, Breaching the 256-Day EMA
Key Highlights
- CCO is trading at CAD 126.99, sliding -2.11% (-CAD 2.74) on Volume of 663.13K shares, after ranging between an intraday low of CAD 126.63 and a high of CAD 131.52.
- Price has broken decisively below both its short-to-medium EMAs—the 21-day EMA (CAD 135.66) and 63-day EMA (CAD 137.76)—and has undercut its macro 256-day EMA (CAD 134.18).
- The 14-day RSI has turned down sharply to 38.08, crossing beneath its 50.61 signal line into weak, sub-40 bearish territory.
- CCO rallied from late 2025 consolidation near CAD 110.00 to an all-time cycle high above CAD 182.00 in February 2026, followed by a choppy multi-month distribution pattern between CAD 140.00 and CAD 175.00 before breaking down toward August lows near CAD 118.00.
- A late-summer counter-trend recovery into the CAD 150.00–CAD 155.00 area failed decisively in early September, precipitating the current high-volume breakdown beneath long-term Moving Average support.
Trend Structure
Cameco's Daily Chart exhibits significant structural deterioration. The stock established a major distribution double-top between February and May 2026 near the CAD 175.00–CAD 182.00 ceiling. While dip-buyers temporarily stabilized the price above the 256-day EMA in August, the rejection at CAD 155.00 confirmed a lower macro high. Today's close at CAD 126.99 violates the confluence of the 21-day, 63-day, and 256-day EMAs, shifting the broader primary trend from sideways consolidation to an intermediate-term breakdown. 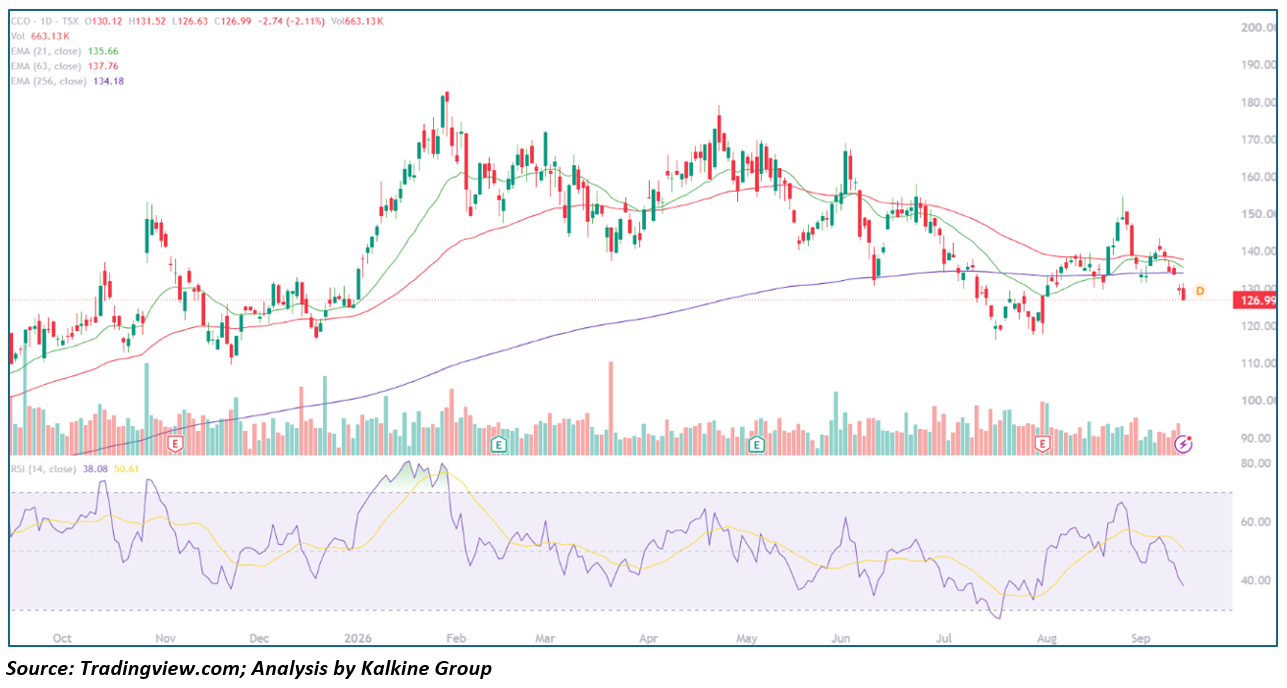
Key Technical Levels
- Resistance:
- CAD 134.18–CAD 135.66: Confluence of the 256-day EMA and 21-day EMA
- CAD 137.76: Dynamic 63-day EMA
- CAD 150.00–CAD 155.00: Late-August recovery peak and horizontal Supply zone
- CAD 182.00+: February 2026 all-time high
- Support:
- CAD 126.63: Intraday session low
- CAD 118.00–CAD 120.00: August 2026 Capitulation low shelf
- CAD 110.00: Major late-2025 base floor
Outlook
Cameco's failure to sustain trade above the 256-day EMA is a high-conviction warning sign for the uranium Mining complex. With RSI sliding below 40 without an immediate bullish divergence, the path of least resistance points toward an extended retest of the August swing low near CAD 118.00–CAD 120.00. Bulls must engineer an immediate close back above CAD 136.00 to reclaim dynamic equilibrium and neutralize breakdown risks.
BWX Technologies, Inc. (NYSE: BWXT) — Second-Largest Decline, Grinding to Fresh Multi-Month Lows
Key Highlights
- BWXT is trading at $146.70, declining -1.23% (-$1.83) on volume of 913.43K shares, moving between a session low of $146.00 and a peak of $150.51.
- Price remains pinned well below its descending 21-day EMA ($156.74) and 63-day EMA ($169.94), having broken below its 256-day EMA ($178.25) back in mid-summer.
- The 14-day RSI reads 36.04, tracking beneath its 40.83 signal line and grinding deeper into oversold territory.
- BWXT advanced steadily from late-2025 levels near $160.00 to an all-time peak near $242.00 in April 2026, before reversing into a sustained six-month cascade of lower highs and lower lows.
- Today's breakdown prints a fresh 52-week low beneath the critical $150.00 psychological shelf.
Trend Structure
BWXT displays an entrenched, orderly downtrend characterized by steady institutional distribution. Following the April peak at $242.00, price lost the 21-day and 63-day EMAs in May, broke below the macro 256-day EMA in July, and has used each successive moving average test as an opportunity for sellers to add short exposure. The tight bear-flagging action seen throughout late August around $155.00–$162.00 has resolved to the downside, with today's drop driving price to its lowest print since late 2025. 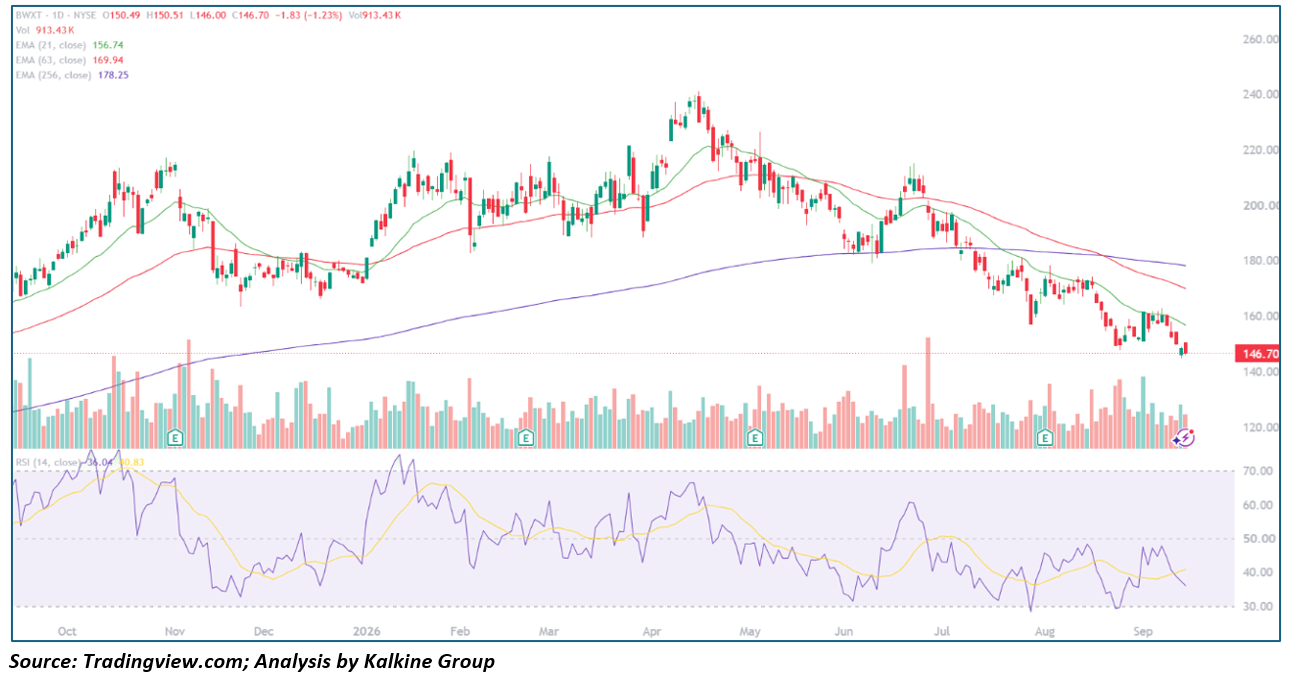
Key Technical Levels
- Resistance:
- $156.74: Dynamic 21-day EMA
- $169.94: Dynamic 63-day EMA
- $178.25: Long-term 256-day EMA
- $200.00–$210.00: Structural June breakdown shelf
- Support:
- $146.00: Session low and immediate horizontal floor
- $140.00: Psychological round-number support
- $125.00–$130.00: Late-2025 structural accumulation base
Outlook
BWXT remains locked in an aggressive intermediate downtrend with zero technical evidence of an impending reversal. Trading beneath all key EMAs with a depressed RSI at 36.04, the stock appears vulnerable to sustained selling toward $140.00. A daily close above the 21-day EMA ($156.74) is the minimum requirement to signal selling exhaustion, while only a structural reclaim above $170.00 would alter the medium-term bear trend.
NuScale Power Corporation (NYSE: SMR) — Failed Moving Average Breakout, Rejecting Overhead Resistance
Key Highlights
- SMR is trading at $8.43, down -0.94% (-$0.08) on volume of 34.62M shares, oscillating between an intraday low of $8.24 and a high of $8.68.
- Price has failed at its overhead dynamic moving averages, trading below the 21-day EMA ($9.41), 63-day EMA ($9.70), and far beneath the macro 256-day EMA ($15.16).
- The 14-day RSI has dropped sharply to 41.87, tumbling beneath its 51.69 signal line and fully neutralizing the early-September momentum surge.
- SMR topped out in late 2025 above $25.00 before experiencing a severe multi-quarter collapse that drove shares to a summer trough near $7.50 in July.
- A high-volume surge in early September lifted price briefly into the $11.50–$12.50 zone, but sellers forcefully rejected the move, re-establishing downward pressure.
Trend Structure
NuScale Power's chart reflects a deep cyclical Bear Market attempting to carve out a horizontal base. The parabolic decline from late 2025 leveled off throughout July and August between $7.50 and $9.00. While the explosive volume spike in early September offered hope of a trend transition, the rally stalled precisely beneath former breakdown resistance near $12.50. The subsequent sharp Reversal has pushed price back beneath both the 21-day and 63-day EMAs, leaving recent buyers trapped overhead. 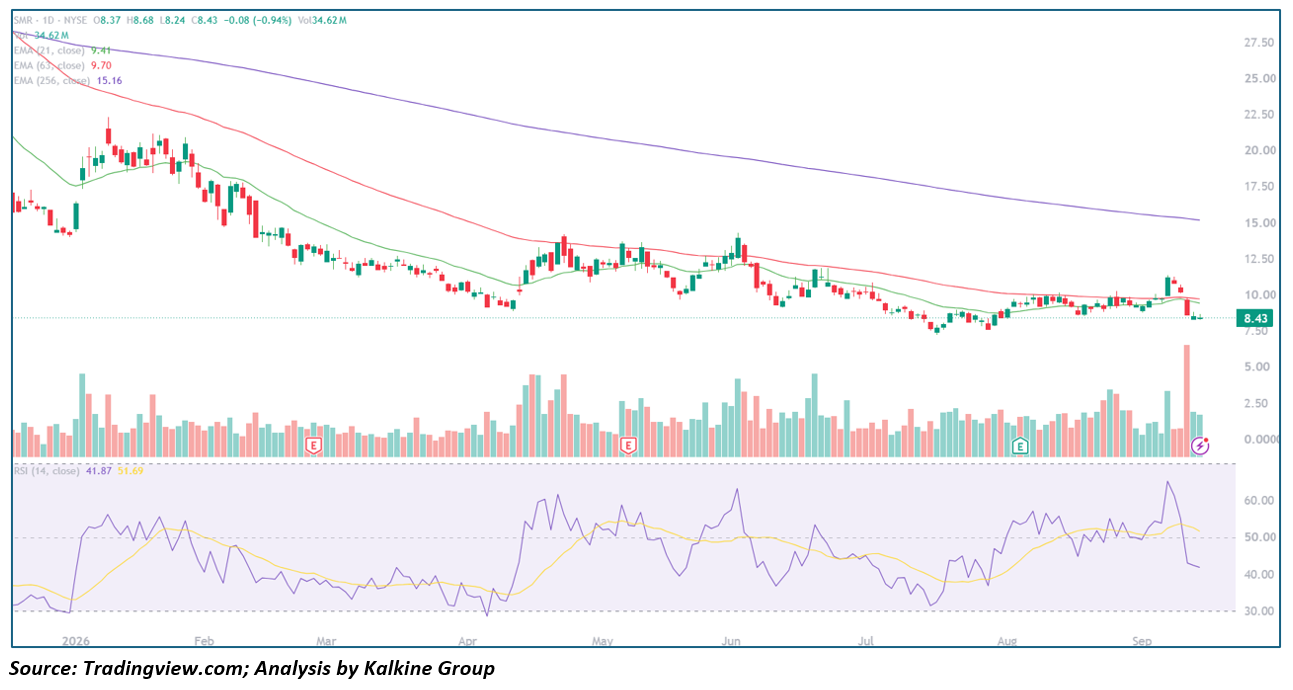
Key Technical Levels
- Resistance:
- $9.41: Dynamic 21-day EMA
- $9.70: Dynamic 63-day EMA
- $12.00–$12.50: Early-September swing high and supply zone
- $15.16: Long-term 256-day EMA
- Support:
- $8.24: Session intraday low
- $7.50: July 2026 multi-month low
- $6.00: Structural downside extension target
Outlook
SMR's sharp rejection from $12.50 and subsequent loss of the $9.40–$9.70 EMA band confirms that overhead supply remains heavy. As long as price remains beneath the 21-day EMA, the technical setup favors a retest of the $7.50 multi-month base. Reclaiming the $9.70 level is essential to stabilize near-term sentiment; otherwise, a breakdown beneath $7.50 exposes fresh multi-year lows.
Oklo Inc. (NYSE: OKLO) — Smallest Percentage Loss, Pinned at Multi-Month Lows
Key Highlights
- OKLO is trading at $35.98, down -0.64% (-$0.23) on volume of 7.32M shares, moving between an intraday trough of $35.27 and a peak of $36.47.
- Price remains suppressed beneath its descending 21-day EMA ($40.41), 63-day EMA ($45.71), and 256-day EMA ($59.38).
- The 14-day RSI sits at 38.26, tracking below its 44.32 signal line and hovering near oversold territory.
- After a historic run from $60.00 in late 2025 to a cycle peak above $180.00 in October 2025, OKLO has undergone a persistent eleven-month Liquidation that has erased roughly 80% of its peak market capitalization.
- Today's price action marks a continuation of grinding lower lows along the lower boundary of its multi-month descending channel.
Trend Structure
Oklo's daily chart demonstrates the most prolonged capital unwind within the AI nuclear power basket. Following the October 2025 blow-off top above $180.00, the stock experienced a cascading liquidation sequence. Relief rallies throughout spring and summer 2026 repeatedly failed at lower dynamic moving average hurdles, with the 256-day EMA acting as an insurmountable ceiling near $60.00–$70.00. The breakdown below $40.00 in early September confirmed continuation of the primary downtrend, with price compressing toward the $35.00 mark on subdued volume. 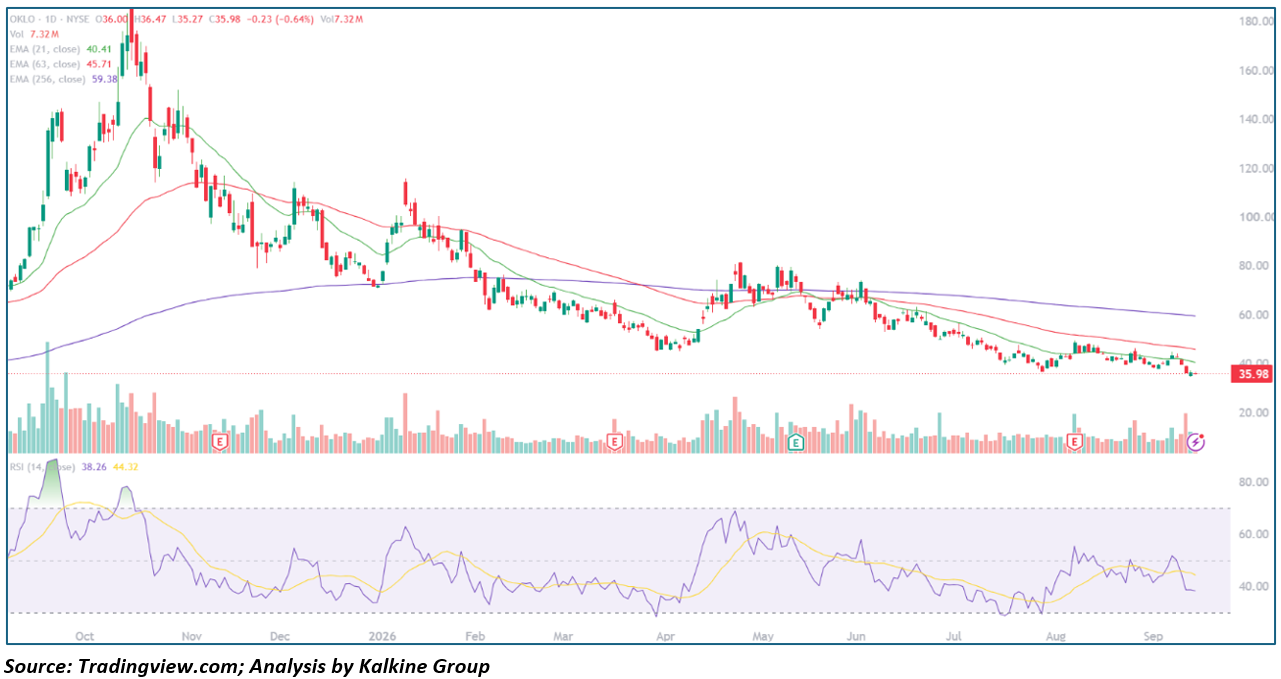
Key Technical Levels
- Resistance:
- $40.41: Dynamic 21-day EMA
- $45.71: Dynamic 63-day EMA
- $50.00: Psychological round-number ceiling
- $59.38: Macro 256-day EMA
- Support:
- $35.27: Intraday session low and immediate support
- $32.00–$34.00: Lower boundary of descending trend channel
- $25.00: Structural macro Demand shelf
- Outlook: OKLO remains entrenched in a defined bear market. With price action pinned beneath the $40.00 moving average shelf and the RSI languishing below 40, rallies are prime candidates for distribution. A sustained close above $45.71 is required to break the downtrend structure; without it, the chart points toward an eventual test of the $30.00–$32.00 range.
Comparative Technical Summary: AI Nuclear & SMR Ecosystem
|
Ticker |
Last Price |
Intraday Change |
21-Day EMA |
63-Day EMA |
256-Day EMA |
14-Day RSI |
Technical Classification |
|---|---|---|---|---|---|---|---|
|
CCO |
CAD 126.99 |
-2.11% |
CAD 135.66 |
CAD 137.76 |
CAD 134.18 |
38.08 |
Structural Technical Breakdown |
|
BWXT |
$146.70 |
-1.23% |
$156.74 |
$169.94 |
$178.25 |
36.04 |
Entrenched Downtrend / Cycle Low |
|
SMR |
$8.43 |
-0.94% |
$9.41 |
$9.70 |
$15.16 |
41.87 |
Overhead Rejection / Range Retest |
|
OKLO |
$35.98 |
-0.64% |
$40.41 |
$45.71 |
$59.38 |
38.26 |
Persistent Channel Liquidation |
This analysis is based on daily chart technical indicators (21/63/256-day EMAs, RSI-14) and price action as of September 15, 2026, and is intended strictly for educational and informational purposes — not individual Investment advice.


 Oct 30, 2026





 Please wait processing your request...