
 CA
 NZ
 UK
 AU
 IND

 US

 Share
 X (Formerly Twitter)
 Whatsapp
 Facebook
 LinkedIn
 Telegram
 Email This Article
 Copy Link
 Summarize with AI
 Chat GPT
 Perplexity

Key Highlights
- Arxis, Inc. (NASDAQ: ARXS) closed at $53.72, rallying to a fresh 52-week high while trading comfortably above both the 20-day EMA ($45.33) and 50-day EMA ($42.55), confirming a strong bullish trend. Arxis is a recently listed aerospace and defense components manufacturer focused on mission-critical electronic and mechanical systems.
- The stock has maintained a powerful sequence of higher highs and higher lows since its April IPO, with buyers consistently stepping in on pullbacks and driving the price to successive breakout levels.
- RSI-14 has climbed above 70, reflecting strong bullish momentum and aggressive buying pressure. While this signals short-term overbought conditions, it also highlights the strength of the prevailing uptrend.
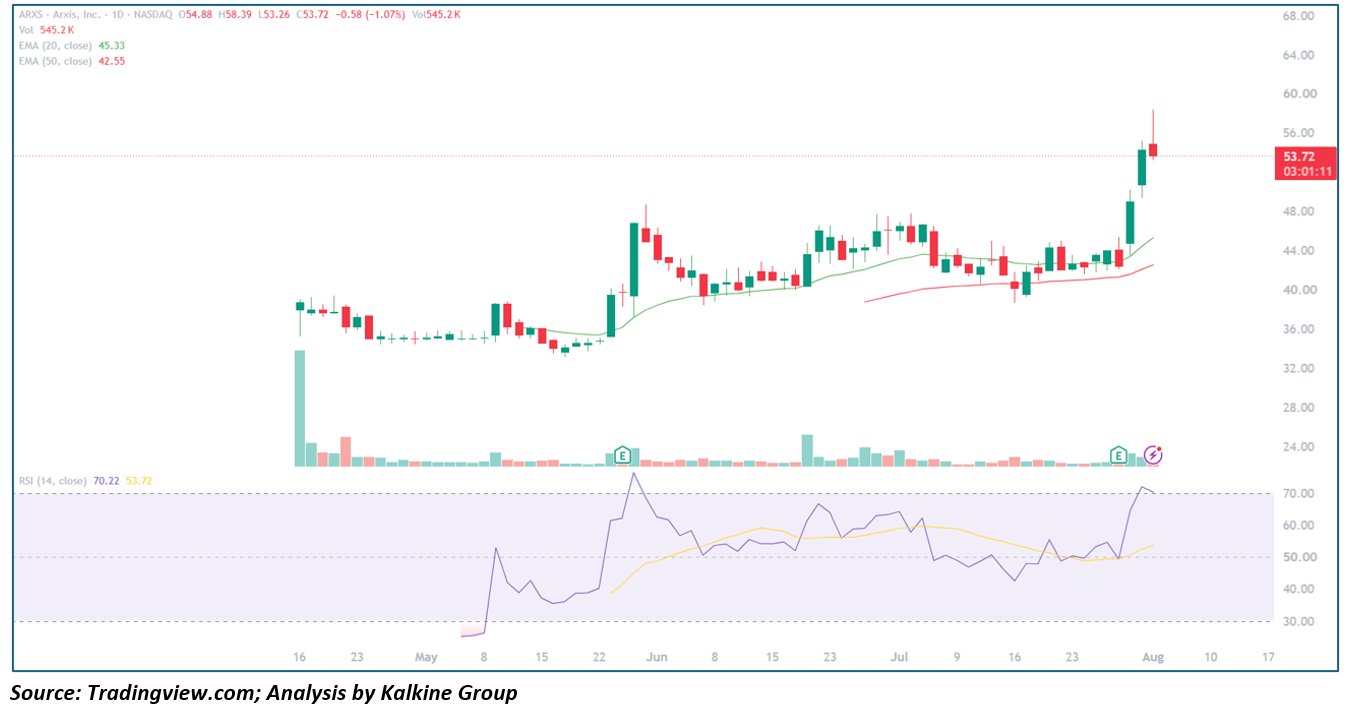
Trend Structure: IPO Breakout, Strong Momentum, and New Highs
Phase 1 – Post-IPO Price Discovery (April 2026)
Following its Nasdaq debut in April, Arxis entered the typical price-discovery phase experienced by newly listed companies. Initial volatility was elevated as investors assessed valuation and growth prospects, but buyers quickly established a support base, preventing a prolonged post-listing decline.
Phase 2 – Bullish Reversal and Trend Confirmation (May – June 2026)
After establishing an early trading range, ARXS began attracting sustained buying interest. The stock reclaimed its short-term moving averages, while the 20-day EMA crossed above the 50-day EMA, confirming a bullish trend reversal. Trading activity strengthened during this period, indicating growing institutional participation and improving market confidence.
Phase 3 – Sustained Higher Highs and Higher Lows (June – July 2026)
The rally evolved into a well-defined uptrend characterized by a consistent sequence of higher highs and higher lows. Every corrective phase was relatively shallow, with buyers defending the rising 20-day EMA. This constructive price action reflects healthy accumulation rather than speculative buying, reinforcing the strength of the broader trend.
Phase 4 – Breakout to a Fresh 52-Week High (Late July – Early August 2026)
The latest advance has propelled ARXS above its previous resistance zone, resulting in a fresh 52-week high. The breakout confirms renewed bullish momentum, with price trading significantly above both key moving averages. The absence of heavy selling near recent highs suggests investors remain confident in the stock's medium-term outlook, keeping the primary trend firmly intact.
Moving Averages: Bullish Alignment Reinforces Trend Strength
Arxis continues to trade well above both the 20-day EMA ($45.33) and the 50-day EMA ($42.55), while both moving averages maintain a positive upward slope. This classic bullish alignment indicates that short-term momentum remains stronger than the intermediate-term trend.
Although the stock has become extended after its recent breakout, similar phases of strength often occur during the early stages of powerful momentum trends. As long as ARXS continues to hold above the rising 20-day EMA, the broader technical outlook remains favorable.
Momentum Analysis: RSI Signals Powerful Buying Interest
The 14-day Relative Strength Index (RSI) has climbed above 70, placing momentum in overbought territory. Rather than signaling an immediate reversal, this reading reflects exceptionally strong buying pressure that frequently accompanies successful breakout stocks.
Historically, strong momentum stocks can remain overbought for extended periods while continuing to advance. Investors should monitor whether RSI begins forming bearish divergence, but as long as it remains above the 60–65 range, the bulls are likely to retain control of the trend.
Key Technical Levels
Resistance
- $54.00–$55.00 – Immediate resistance near the recent breakout high.
- $58.00 – Next upside target if momentum continues.
- $60.00 – Major psychological resistance and medium-term objective.
Support
- $50.00–$51.00 – Initial support near the recent breakout zone.
- $45.33 – 20-day EMA and first dynamic support.
- $42.55 – 50-day EMA and key intermediate support.
- $40.00 – Stronger structural support if a deeper correction develops.
Scenario Analysis
Bullish Scenario
If ARXS continues holding above the $50–$51 breakout zone, buyers could extend the rally toward $58, with $60 becoming the next major upside objective. Strong momentum, rising moving averages, and continued institutional interest support this outlook.
Base Case
Following its sharp advance, the stock may consolidate between $50 and $54, allowing RSI to cool while the moving averages catch up with price. Such consolidation would strengthen the technical foundation for another breakout attempt.
Bearish Scenario
A decisive break below the recent breakout level, especially if accompanied by weakness below the 20-day EMA, could trigger a pullback toward the 50-day EMA near $42.55. However, unless that level is violated, the broader uptrend would likely remain intact.
Conclusion
Arxis, Inc. continues to exhibit one of the strongest momentum profiles among recently listed industrial and aerospace-related companies. Its breakout to a new 52-week high, supported by rising moving averages, a well-defined pattern of higher highs and higher lows, and strong RSI momentum, underscores sustained buying interest. While the overbought RSI suggests a period of short-term consolidation would be healthy, the overall technical structure remains firmly bullish. As long as ARXS holds above its recent breakout zone and key moving averages, the path of least resistance continues to favor the upside, with $58–$60 emerging as the next key target for bullish investors.
This technical analysis is based solely on the price chart provided and is intended for educational and informational purposes only. It is not financial advice. Technical patterns can fail, and investment decisions should incorporate fundamental analysis, risk tolerance, and consultation with a qualified financial advisor where appropriate.


 Nov 18, 2026





 Please wait processing your request...