
A decisive break above the Fibonacci 0.5 extension level, RSI-14 building powerfully from mid-range, and today's session Volume surging to 37.55M shares — TeraWulf Inc. (Nasdaq: WULF) is staging one of the most technically compelling breakouts in the Cryptocurrency Mining space, with Fibonacci extension levels mapping out a clear roadmap toward $27, $29, and ultimately $31
Key Highlights
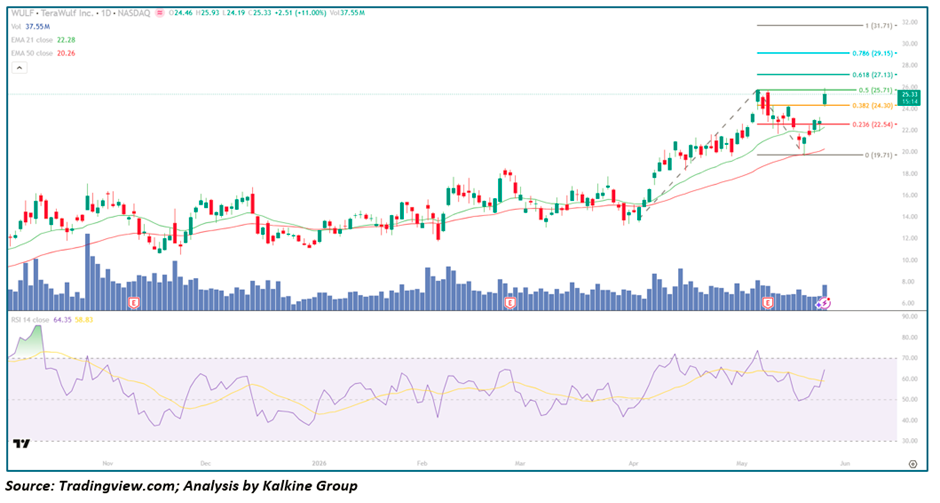
- TeraWulf Inc. (NASDAQ: WULF) closed at $25.33, surging +$2.51 (+11.00%) in a powerful momentum expansion session that breaks above the Fibonacci 0.5 extension level at $25.71
- Price traded between $24.19 and $25.93 intraday, closing near the session high — confirming sustained institutional buying pressure throughout the entire session
- The stock is trading significantly above both the EMA-21 ($22.28) and EMA-50 ($20.26), confirming a powerfully bullish trend structure with both averages rising steeply in bullish alignment
- RSI-14 at 64.35 with signal at 58.83 — advancing constructively with a wide and active bullish crossover, main line well above signal, and significant runway remaining before reaching overbought extremes
- Volume surged to 37.55M shares — an extraordinary reading that dwarfs the Average Daily Volume and confirms this move carries genuine institutional and momentum-driven conviction
- TeraWulf Inc. (NASDAQ: WULF) has rallied from below $14 in early April to above $25 — a gain of over 80% in approximately seven weeks — as Bitcoin infrastructure thematic accelerates aggressively
Understanding the Fibonacci Extension Indicator Plotted on the Chart
The Fibonacci Extension tool plotted on TeraWulf Inc. (NASDAQ: WULF)'s chart is a forward-looking projection instrument that does something fundamentally different from the Fibonacci Retracement tool. While a retracement measures how far a pullback has gone within a prior move, a Fibonacci extension projects how far the next advance could travel beyond the prior high — giving traders precise, mathematically derived price targets for a trend in motion.
The extension is constructed by identifying three key points: the origin of a prior swing low, the subsequent swing high, and the retracement low from which the current advance began. On TeraWulf Inc. (NASDAQ: WULF)'s chart, these three anchor points appear to be the April 2026 swing low near $14, the initial surge high near $26, and the subsequent pullback low from which the current leg higher originated. The tool then projects multiple extension levels above the prior high as potential resistance and target zones.
The five extension levels visible on the chart and their significance:
0 (Base level at $19.71) — This is the retracement low that anchors the entire Fibonacci extension measurement — the exact price point from which the current advance was launched. It represents the 0% extension level, meaning price has advanced Zero Percent beyond the baseline. On TeraWulf Inc. (NASDAQ: WULF)'s chart, this level near $19.71 served as the springboard for the current explosive move and now acts as a deep structural support level. A decline back to this level would represent a full retracement of the current extension leg and would require a fundamental reassessment of the near-term thesis.
0.236 ($22.54) — The first meaningful extension level, representing a 23.6% advance beyond the base. This level aligns almost precisely with the current EMA-21 at $22.28, creating a powerful confluence of dynamic EMA support and Fibonacci structural support at the same price zone. TeraWulf Inc. (NASDAQ: WULF) used this level as a springboard during the most recent consolidation phase before today's explosive advance, confirming that buyers were active and informed at this junction.
0.382 ($24.30) — The 38.2% extension level, representing the first significant Fibonacci projection target beyond the base. This level was tested and briefly breached during the recent consolidation before buyers stepped in decisively. It now acts as a key support level on any near-term pullback — a close back below $24.30 on elevated volume would signal that the current extension leg is losing momentum.
0.5 ($25.71) — The 50% extension level and the most psychologically significant projection target on the chart. Today's close at $25.33 is approaching this level with considerable momentum — the intraday high of $25.93 already penetrated above it. In Fibonacci extension analysis, the 0.5 level frequently acts as either a powerful resistance zone where advances pause and consolidate, or — when broken convincingly — as an accelerant that triggers the next rapid move toward higher extension levels. The behaviour at this level over the coming sessions will be the defining technical test for TeraWulf Inc. (NASDAQ: WULF)'s near-term trajectory.
0.618 ($27.13) — The golden ratio extension level, considered by Fibonacci practitioners to be the most important projection target in the entire framework. A move to $27.13 would represent a 61.8% extension beyond the base and is the primary bull case target for the current advance. Historically, stocks that clear the 0.5 extension level with strong volume — as TeraWulf Inc. (NASDAQ: WULF) is doing today — frequently reach the 0.618 level before any meaningful consolidation occurs.
0.786 ($29.15) — The 78.6% extension level, representing an advanced projection target that would only come into play if momentum sustains above the 0.618 level. This level at $29.15 is the secondary bull case target and would represent a major technical milestone confirming that the Bitcoin Mining thematic is generating sustained institutional Demand.
1.0 ($31.71) — The full 100% extension, representing a price doubling from the base level of the measured move. At $31.71, this is the maximum bull case projection for the current extension leg and would mark an extraordinary achievement for TeraWulf Inc. (NASDAQ: WULF)'s price recovery. This level is realistic only in a scenario of continued Bitcoin price strength, positive fundamental catalysts, and sustained momentum expansion.
What the Fibonacci extension tells us about today's session: Today's close at $25.33 — just below the 0.5 extension at $25.71 with an intraday penetration above it — is a classic test of the most critical projection level. The fact that TeraWulf Inc. (NASDAQ: WULF) achieved this test on volume of 37.55M shares suggests that the 0.5 level will be cleared convincingly on follow-through sessions, opening the path toward the 0.618 golden ratio target at $27.13.
Trend Structure: From Prolonged Range to Parabolic Extension
Phase 1 — Extended Range & Accumulation (Oct 2025 – Mar 2026)
TeraWulf Inc. (NASDAQ: WULF) spent the first five months of the chart period in a prolonged, choppy trading range between $12 and $18:
- Both EMAs oscillating without sustained directional conviction throughout the period
- Multiple Earnings events produced temporary volume spikes and brief directional moves that failed to establish lasting trends
- RSI-14 cycling repeatedly between 45 and 70 — range-bound oscillation without momentum expansion
- Price respecting the EMA-21 as both support and resistance on alternating sessions — the hallmark of a trendless, accumulation-phase market
- The extended choppiness masked a gradual upward bias that would eventually resolve into the current explosive advance
This prolonged accumulation phase created the compressed energy that powered the subsequent breakout.
Phase 2 — Breakout Ignition & Initial Surge (Mar – Apr 2026)
The character of the chart changed dramatically in March 2026:
- An earnings catalyst in late March produced a significant volume spike and ignited the first decisive breakout above the $14–$15 resistance zone
- Price accelerated sharply from $14 toward the $26 region in a matter of weeks — establishing the swing high that anchors the Fibonacci extension measurement
- Both EMAs turned aggressively higher, rising in steep bullish alignment
- RSI-14 pushed toward and above 70 as momentum reached its initial peak
- The dashed curved line on the chart traces this parabolic advance — a visual representation of the acceleration that established the upper anchor point for the extension tool
Phase 3 — Fibonacci Retracement & Re-Launch (Apr – May 2026)
Following the initial surge, TeraWulf Inc. (NASDAQ: WULF) underwent a controlled corrective phase:
- Price retraced from the $26 highs toward the $19.71 base level — the 0% Fibonacci extension anchor
- The correction was orderly and held above the EMA-21, which had risen to provide dynamic support near $20–$22
- RSI-14 reset toward the 50–55 zone — a healthy mid-range reload without reaching oversold extremes
- The 0.236 Fibonacci extension level at $22.54 aligned with the EMA-21 to create a powerful dual-support confluence that attracted buyers
- Today's +11.00% session on 37.55M volume represents the decisive re-launch from that support confluence — a breakout of the highest conviction
Moving Averages: Steep Bullish Alignment Confirms Trend Velocity
The EMA-21 at $22.28 is rising at its steepest angle since the initial March breakout phase, sitting approximately 12% below current price. Its near-perfect alignment with the 0.236 Fibonacci extension level at $22.54 creates one of the most powerful support confluences on the chart — a zone where Fibonacci structure and dynamic EMA support converge to provide double validation for buyers on any pullback. Every meaningful correction during the current advance has found buyers at or near this dual-support zone.
The EMA-50 at $20.26 has turned steeply higher after months of flat to declining behaviour during the range-bound Phase 1, now sitting approximately 20% below current price. Its near-alignment with the Fibonacci base level at $19.71 creates a deep structural support confluence that represents the ultimate defence line for the broader bull thesis. The widening gap between EMA-21 and EMA-50 — currently over $2 and expanding rapidly — confirms that trend velocity is accelerating rather than moderating.
Momentum Analysis: RSI-14 Wide Bullish Crossover With Significant Runway
RSI-14 at 64.35 with the signal line at 58.83 produces one of the widest bullish crossover spreads visible on the chart — a gap of over 5 points between the main line and signal line that reflects strong and accelerating momentum rather than a tentative or early-stage crossover. This configuration is the technical equivalent of a trend in full stride — not extended enough to be vulnerable to near-term exhaustion, but powerful enough to confirm that institutional buyers are pressing aggressively.
The RSI-14 history on TeraWulf Inc. (NASDAQ: WULF)'s chart shows a consistent pattern: when RSI advances from the mid-range 55–65 zone toward 70 and above, the strongest price gains occur. The current reading of 64.35 places the oscillator at precisely the mid-point of that historically productive zone, suggesting the most powerful phase of the current advance may still lie ahead.
Volume Analysis: 37.55M Shares — One of the Most Significant Sessions in Chart History
Today's volume of 37.55M shares is extraordinary — it represents a multiple of the average daily volume visible throughout the chart's history and confirms that today's session is not a routine advance driven by retail momentum. Volume events of this magnitude in the context of a Fibonacci extension breakout signal one thing with near certainty: institutional participants have made a decisive and large-scale commitment to TeraWulf Inc. (NASDAQ: WULF) at current levels.
The volume structure throughout the broader advance from the March lows has been exemplary — elevated on breakout sessions, lighter on corrective days, with no heavy-volume Reversal sessions suggesting distribution. The overall profile is consistent with a stock experiencing genuine institutional accumulation within a Bitcoin infrastructure thematic that is attracting significant Capital allocation.
Key Technical Levels
Resistance Levels — Fibonacci Extension Targets
- $25.71 — Fibonacci 0.5 extension — immediate and critical resistance, intraday penetrated today
- $27.13 — Fibonacci 0.618 golden ratio extension — primary bull case target
- $29.15 — Fibonacci 0.786 extension — secondary bull case target
- $31.71 — Fibonacci 1.0 full extension — maximum bull case projection
Support Levels — Fibonacci Extension and EMA Confluence
- $24.30 — Fibonacci 0.382 extension — immediate pullback support
- $22.54 / EMA-21 $22.28 — powerful dual confluence support zone
- $20.26 — EMA-50 structural support
- $19.71 — Fibonacci 0 base level — ultimate bull thesis defence
Scenario Analysis
- Bullish Continuation (Primary Case)
TeraWulf Inc. (NASDAQ: WULF) sustains above the $24.30 Fibonacci 0.382 level and follows through on today's session: → The 0.5 extension at $25.71 is cleared convincingly on a close above that level → Momentum accelerates toward the 0.618 golden ratio target at $27.13 — the primary bull case destination → RSI-14 advancing toward 70 validates the momentum expansion phase → Bitcoin infrastructure thematic and continued institutional flows sustain the advance
- Consolidation at 0.5 Extension (Constructive Outcome)
Following today's sharp advance, TeraWulf Inc. (NASDAQ: WULF) consolidates near the 0.5 level: → Price oscillates between $23.50–$26.00 while RSI stabilises in the 58–66 zone → EMA-21 rises toward $23.50–$24.00, reducing the extension and tightening the base → A flag or pennant formation between the 0.382 and 0.5 extension levels would be a high-conviction continuation pattern → No thesis damage while price holds above the 0.382 level at $24.30
- Mean Reversion to EMA-21 Confluence (Risk Case)
Profit-taking from today's extraordinary volume session triggers a sharp but contained correction: → Price retraces toward the EMA-21 / 0.236 extension confluence near $22.28–$22.54 → This zone represents maximum institutional support — a convergence of dynamic EMA and Fibonacci structure → A hold of this level on any corrective session would confirm the broader bull thesis is intact → A close below EMA-21 on elevated volume shifts near-term bias to neutral and requires reassessment
Conclusion: TeraWulf Inc. (NASDAQ: WULF) Has Delivered a Fibonacci Extension Breakout of the Highest Conviction — The $27 Golden Ratio Target Is Now the Primary Objective
TeraWulf Inc. (NASDAQ: WULF) has produced an extraordinary technical session — an 11.00% surge on 37.55M shares that tests the critical 0.5 Fibonacci extension level at $25.71 with the intraday high already penetrating above it. The Fibonacci extension framework maps the road ahead with precision: a sustained close above $25.71 opens the 0.618 golden ratio target at $27.13, beyond which the 0.786 level at $29.15 and the full 1.0 extension at $31.71 become realistic medium-term objectives. The EMA structure, RSI momentum configuration, and volume profile all align in support of the primary bullish case.
The framework moving forward is clear:
- Above $25.71 (Fibonacci 0.5) → momentum dominant, primary target 0.618 golden ratio at $27.13
- Above $27.13 (Fibonacci 0.618) → golden ratio cleared, advance toward 0.786 at $29.15 opens
- Above $29.15 (Fibonacci 0.786) → momentum expansion, full extension target at $31.71 comes into view
- Below $24.30 (Fibonacci 0.382) → near-term caution, consolidation phase likely
- Below EMA-21 at $22.28 → broader advance thesis under review, reassess positioning
- Below $19.71 (Fibonacci 0 base) → extension leg invalidated, structural reassessment required
For momentum traders and Bitcoin infrastructure investors, TeraWulf Inc. (NASDAQ: WULF) is presenting one of the most clearly mapped and technically well-supported opportunity sets in the current market — a Fibonacci extension breakout confirmed by extraordinary institutional volume, with multiple precisely defined upside targets and a clear invalidation framework for risk management.
_06_11_2026_12_45_08_746277.jpg)


 Please wait processing your request...