
Key Highlights
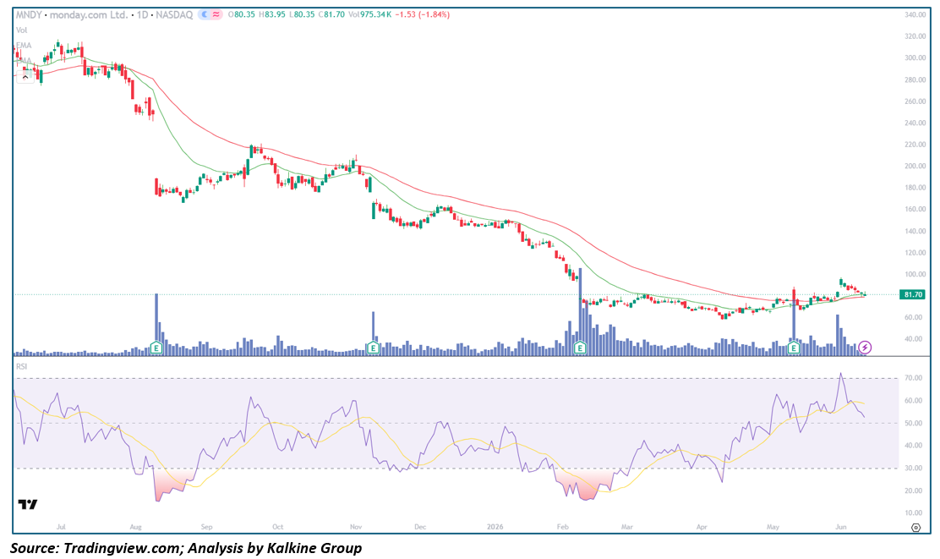
- MNDY is trading near $80, having fallen from a 52-week high of $316.98 — a collapse of approximately 75% that ranks among the most severe drawdowns of any profitable, growing software company in recent memory
- The severity of the decline is entirely disproportionate to the fundamental trajectory, which continues to show 24% revenue growth, doubling GAAP operating income, and record enterprise customer additions
- Both the EMA-21 and EMA-50 are declining and well above current price — a technically damaged structure that requires patience and base-building confirmation before aggressive long entries are warranted
- RSI has reached deeply oversold territory and is beginning to show nascent divergence signals — historically a high-accuracy precursor to major trend reversals in growth stocks after extended capitulation phases
- Q1 2026 revenue of $351.3 million beat consensus of $339 million by over 3.6%, with the AI Work Platform launch and shift to consumption-based pricing representing the most structurally important strategic pivot in the company's history
- AI products drove 10% of net new ARR in Q1 — a metric that, if it compounds at current trajectory, will fundamentally re-rate MNDY's growth profile by 2027
Trend Structure: Distribution, Collapse, and the Search for a Floor
Phase 1 — Distribution and Topping Process (Late 2025 – Early 2026)
MNDY constructed an extended topping pattern near the $280–$317 range through late 2025 and early 2026. Volume analysis during this phase reveals classic institutional distribution: elevated volume on down days, declining volume on weak rallies, and a series of lower highs beneath the peak despite surface-level price stability. The stock was being sold, not accumulated, in this zone.
Phase 2 — Accelerated Markdown and Capitulation (Jan – Jun 2026)
The breakdown from the $280 distribution zone accelerated through every meaningful technical support level — the 50-day, 200-day, prior Fibonacci levels, and round-number supports alike — without finding sustained institutional demand. Fears that AI would hollow out per-seat SaaS pricing drove an indiscriminate de-rating that treated MNDY as a business model casualty rather than a business model beneficiary of AI.
Phase 3 — Potential Bottoming Structure Emerging (Jun 2026)
At $80, MNDY is trading near its 52-week low of $57.50 but has bounced materially from that extreme. The RSI divergence structure developing on the weekly chart — where price has made lower lows but RSI has made higher lows — is one of the most reliable reversal signals in technical analysis when accompanied by volume exhaustion on final down legs.
Fundamental Foundation: The Numbers Do Not Support the Price
The paradox of MNDY's technical collapse is that the fundamental trajectory has not deteriorated — it has improved. Revenue grew 24% year-over-year. GAAP operating income doubled to $19.8 million. Record net adds of customers spending over $500,000 in ARR confirm the enterprise motion is working. The AI Work Platform with Native Agents — launched in Q1 — positions monday.com as a beneficiary of AI-driven workflow automation rather than a victim of it.
The pivot to consumption-based pricing is the key long-term structural change. Under per-seat pricing, revenue scales with headcount. Under consumption pricing, revenue scales with AI agent activity — and AI agents do not negotiate contracts, request sick days, or cap their usage at 40 hours per week. Every unit of AI work is billable, creating a usage-driven flywheel with no equivalent in traditional SaaS economics.
The Consumption Pricing Catalyst
Management's statement that AI productivity gains are allowing the company to grow revenue without growing headcount in lockstep is not a cost story — it is a margin story. If AI agents handle a growing share of workflow tasks, and those agents generate consumption revenue for monday.com, the company's revenue-per-customer metric expands without proportional cost increases. This is the economic model of a utility, not a software company — and utilities trade at very different multiples than per-seat SaaS businesses in a growth phase.
Key Technical Levels
Resistance: $90–$95 — EMA-21 overhead resistance | $110–$115 — declining EMA-50 | $130–$140 — prior breakdown zone and major supply overhead
Support: $78–$80 — current trading zone and near-term support | $70–$72 — prior base and structural floor | $57–$60 — 52-week low zone; catastrophic bear scenario for longs
Scenario Analysis
- Bullish Reversal (Base Case for Patient Investors): RSI divergence confirms, weekly candle closes above $88–$90 on expanding volume → EMA-21 reclaimed → targets $110–$115 within 8–12 weeks
- Extended Base Building: Price oscillates $72–$90 for several weeks, digesting the prior decline while RSI rebuilds above 50 → gradual re-rating begins as Q2 2026 earnings confirm AI revenue traction
- Bearish Continuation (Risk): Macro risk-off or SaaS sector de-rating breaks $72 → downside toward 52-week low at $57–$60
Conclusion
MNDY at $80 represents one of the most extreme disconnects between fundamental business quality and stock price in the current mid-cap software universe. A 75% collapse in a company delivering 24% revenue growth, record enterprise additions, and a transformative AI platform launch is the definition of capitulation-driven mispricing. Above $90 the technical structure begins to repair. The $57–$60 low represents the floor of the catastrophic bear scenario. Patient, conviction-driven investors are building positions in this zone.
_06_11_2026_00_01_09_368404.jpg)


_06_10_2026_23_58_15_597808.jpg)
_06_10_2026_23_59_01_962593.jpg)

 Please wait processing your request...