
Key Highlights
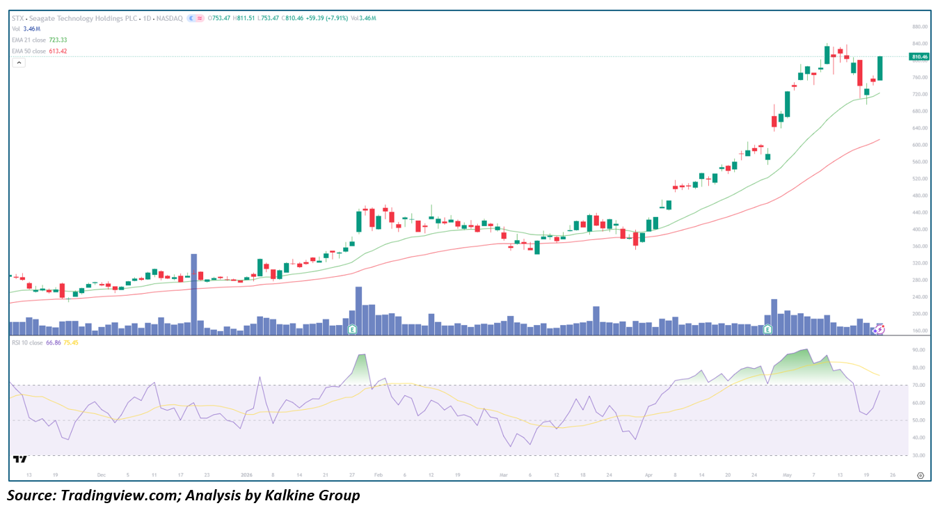
- STX closed near 790.57 after a strong rebound session
• Price traded between 753.47 and 818.45 intraday, reflecting elevated momentum Volatility
• The stock remains firmly above the EMA-21 (723.34) and EMA-50 (631.43), confirming strong bullish trend alignment
• RSI recovered toward 66.87 after cooling from prior overbought territory
• Volume remained elevated at 30.3M shares, suggesting continued institutional participation
• The stock has rallied aggressively from the 300–350 zone over recent months
• Current price behavior suggests healthy consolidation within a larger bullish trend rather than Reversal conditions
Trend Structure: From Gradual Recovery to Vertical Momentum Expansion
Phase 1 — Base Formation & Early Recovery (Nov 2025 – Feb 2026)
STX initially spent several months building a gradual accumulation base following earlier weakness.
During this phase:
- Price stabilized above long-term support zones
• Moving averages flattened progressively
• Volume accumulation began improving gradually
• Momentum shifted from bearish to neutral
The recovery structure strengthened materially once price reclaimed both major moving averages.
Phase 2 — Trend Acceleration & Institutional Breakout (Mar – Apr 2026)
The technical structure improved dramatically during the spring breakout phase.
Key developments included:
- Aggressive breakout candles above prior resistance
• EMA-21 crossing decisively above EMA-50
• Strong higher-high and higher-low formations
• Expanding volume during upside continuation sessions
This phase reflected renewed institutional Demand tied to broader AI infrastructure enthusiasm and storage-related growth expectations.
Phase 3 — Momentum Expansion & Controlled Consolidation (May 2026)
The current structure reflects a powerful momentum uptrend entering a temporary digestion phase.
STX has now:
- Reached fresh multi-month highs above 800
• Successfully defended pullbacks toward the EMA-21
• Maintained strong trend structure despite volatility
• Continued attracting strong participation on rebound sessions
Rather than breaking down, recent weakness appears consistent with healthy consolidation following a near-vertical rally.
Moving Averages: Strong Bullish Alignment Remains Intact
The moving-average structure remains decisively bullish.
EMA-21 (723.34)
- Rising aggressively upward
• Acting as primary short-term trend support
• Successfully supported recent pullbacks
EMA-50 (631.43)
- Trending steadily higher
• Reinforces the broader medium-term uptrend
• Sits well below current price, reflecting strong momentum acceleration
The wide separation between current price and moving averages confirms powerful upside momentum, although near-term volatility risk remains elevated after such an extended advance.
Momentum Analysis: RSI Reflects Strong Trend Continuation
RSI currently sits near 66.87 after cooling from overbought territory earlier in the rally.
This behavior suggests:
- Momentum remains bullish but not excessively overheated
• Buyers continue controlling trend direction
• The recent pullback successfully reset short-term momentum conditions
Importantly, RSI stabilization above the 60 zone often reflects sustained institutional trend strength during major momentum expansions.
Volume Analysis: Institutional Participation Appears Persistent
Volume behavior continues supporting the bullish thesis.
Key observations include:
- Elevated participation during breakout sessions
• Strong rebound volume following pullbacks
• Reduced panic selling during consolidation phases
This type of activity is commonly associated with:
- Institutional accumulation
• Momentum-driven inflows
• High-conviction trend continuation buying
At present, the rally appears structurally supported rather than purely speculative.
Key Technical Levels
Resistance Levels
- 820–850 — immediate breakout resistance zone
• 900 — psychological expansion target
• 950–1000 — long-term momentum extension zone
Support Levels
- 750–720 — near-term support and EMA-21 region
• EMA-50 at 631 — major medium-term support
• 560–580 — prior breakout base
Scenario Analysis
- Bullish Continuation (Primary Case)
If STX sustains above the 720–750 support region:
→ Momentum could extend toward 850–900
→ RSI may re-enter strong expansion territory
→ AI infrastructure demand could continue fueling upside participation
- Consolidation Phase (Healthy Outcome)
Following the sharp rally, the stock may continue consolidating sideways:
→ Trading range between 720–820
→ RSI cools gradually
→ EMA-21 catches up beneath price
This would reinforce the broader bullish structure.
- Bearish Reversal (Risk Case)
A breakdown below the EMA-21 with heavy selling pressure could trigger a deeper pullback:
→ First downside target near EMA-50 at 631
→ Below 630 would weaken trend momentum materially
→ Institutional momentum participation could slow temporarily
Currently, this remains a secondary scenario.
Conclusion: STX Continues Acting Like a High-Momentum AI Infrastructure Leader
Seagate Technology has transitioned from a steady recovery stock into a powerful momentum-driven AI infrastructure and storage leader.
The technical structure now reflects:
- Strong bullish moving-average alignment
• Sustained institutional-quality volume
• Healthy consolidation within an established uptrend
• Strong higher-high and higher-low behavior
• Continued momentum Leadership characteristics
The framework moving forward is becoming increasingly clear:
- Above 720–750 → bullish momentum remains dominant
• Above 820 → breakout acceleration likely resumes
• Below EMA-21 → short-term caution increases
For momentum traders and growth-focused investors, STX continues behaving like a leading infrastructure beneficiary of the expanding AI and cloud-computing ecosystem, with current price action suggesting institutional demand remains firmly supportive of the broader uptrend.
_06_11_2026_12_45_08_746277.jpg)


 Please wait processing your request...