
Key Highlights
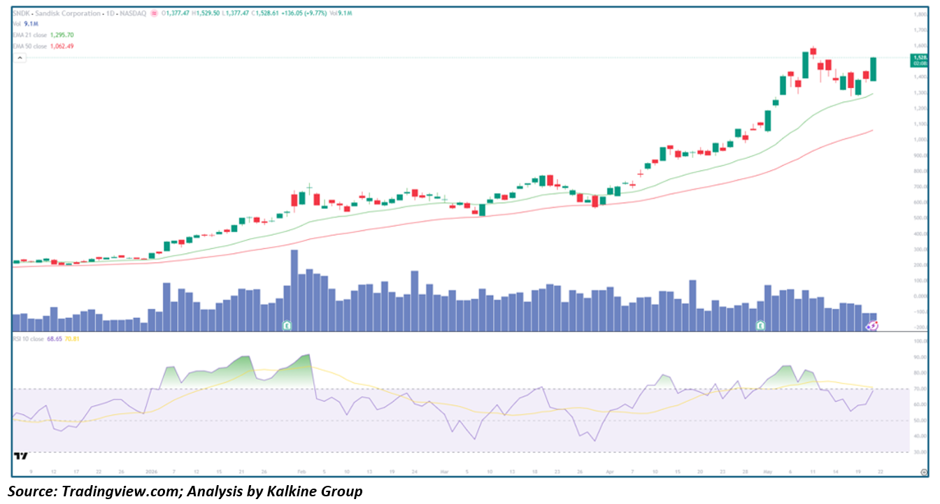
- Sandisk (SNDK) is trading at $1,528.61, up a massive +$136.05 (+9.77%) on the day, reclaiming and pushing beyond the prior all-time high of ~$1,580 set in late April
- Price is trading well above EMA-21 (~$1,295.70) and far above EMA-50 (~$1,062.49), with both moving averages in a steep bullish alignment confirming a dominant primary uptrend
- RSI-10 at 68.65 is approaching but not yet in overbought territory, with the signal line at 70.81 — notably, RSI has reset cleanly from the prior overbought spike and is now curling back upward with momentum
- Volume at 9.1M is elevated and meaningful, suggesting institutional participation on today's surge rather than a low-conviction retail-driven move
- The stock has compounded an extraordinary move — from ~$200 in December 2025 to $1,528 today — a gain of over 660% in under six months
Trend Structure: One of the Strongest Charts on the Nasdaq
Sandisk has delivered one of the most relentless and structurally clean uptrends visible anywhere in the large-cap technology space. From a base near $200 in late November 2025, the stock has ground higher in a near-unbroken series of higher highs and higher lows, respecting both the EMA-21 and EMA-50 at every meaningful pullback without once closing below the 50 for any sustained period.
The trend accelerated meaningfully in February and again in April, with each leg higher accompanied by expanding price action and healthy volume. The brief consolidation between late April and mid-May — where price pulled back from ~$1,580 toward the $1,300–$1,350 zone and found support precisely at the rising EMA-21 — was textbook trend behavior: a controlled reset that shook out weak hands before the next leg.
Today's +9.77% surge on strong volume of 9.1M represents a decisive breakout from that consolidation, suggesting the brief digestion phase is complete and the primary uptrend is resuming with force.
RSI Setup: Clean Reset — Momentum Reloaded
The RSI-10 at 68.65 tells a constructive story. After registering overbought readings above 70 during the April price peak — accurately flagging the short-term exhaustion — the RSI corrected alongside price during the May consolidation, pulling back toward the 50 level before curling sharply upward again.
This pattern of RSI resetting from overbought, finding support near the midline, and then re-accelerating higher is one of the most reliable signatures of a stock in a genuine strong uptrend rather than a speculative blow-off. The RSI has not broken down into oversold territory at any point during this entire multi-month rally — a hallmark of sustained institutional accumulation.
With the RSI now at 68.65 and the signal line at 70.81 just overhead, a cross above the signal line in the coming sessions would confirm the momentum reload and historically on this chart has preceded the next meaningful price leg higher.
Moving Averages: Bullish Alignment Remains Impeccable
The Moving Average structure on SNDK remains one of the cleanest on the board:
- EMA-21 (~$1,295.70) — price bounced precisely from this level during the recent May consolidation, confirming it as dynamic support. It continues to slope steeply upward and is the first line of defence for bulls on any future pullback
- EMA-50 (~$1,062.49) — over $460 below current price, this level has not been tested since the February acceleration began. Its steep upward trajectory reflects the extraordinary pace of the trend and represents the ultimate bull/bear line for the longer-term thesis
- Spread between EMAs — the wide and expanding gap between the 21 and 50 confirms the trend is in a strong, mature acceleration phase rather than early-stage mean reversion
As long as price continues to hold above the EMA-21 on any intraday or multi-day dips, the structure remains unambiguously bullish.
Volume: Institutional Conviction on Display
Today's 9.1M volume is one of the larger sessions visible on the recent chart and stands in sharp contrast to the lighter, drifting volume seen during the mid-May consolidation. This divergence — declining volume on the pullback, surging volume on the breakout — is precisely the accumulation signature that institutional desks leave behind when they are absorbing Supply and then re-engaging on strength.
The two prior high-volume spikes visible on the chart — one in early February and one in early May — both coincided with significant upside price moves, reinforcing the pattern that elevated volume on SNDK has consistently been a bullish rather than a distribution signal throughout this trend cycle.
Key Technical Levels and Scenarios
Resistance Levels
- $1,580 — prior all-time high; immediate test level
- $1,600+ — psychological round number and next upside target
- $1,700+ — measured move target from the May base breakout
Support Levels
- $1,380–$1,420 — recent consolidation range and near-term floor
- $1,295 — EMA-21 and key dynamic support
- $1,062 — EMA-50 and ultimate trend support
Scenarios
- Continuation to New Highs (Primary Case) — Today's volume-backed breakout holds, RSI crosses back above its signal line, and SNDK pushes through $1,580 to set fresh all-time highs. The $1,600–$1,700 range becomes the next logical target zone as momentum traders and breakout buyers pile in.
- Consolidation at New High (Secondary Case) — Price stalls near the $1,550–$1,580 zone and enters another brief period of sideways digestion, building a higher base before the next leg. This would be a healthy and constructive outcome that resets RSI and sets up a cleaner entry.
- Failed Breakout / Pullback to EMA-21 (Risk Case) — If today's move lacks follow-through and selling emerges at the prior highs, a retest of the $1,295 EMA-21 support is possible. This would not break the uptrend but would require bulls to defend that level convincingly to avoid a more meaningful correction.
Conclusion: Breakout Confirmed — Trend Integrity Intact and Accelerating
Sandisk is exhibiting the characteristics of a stock where institutional Demand consistently outpaces supply at every meaningful pullback. The six-month chart is a masterclass in trend structure — higher highs, higher lows, EMA support respected, and RSI cycling between overbought resets and momentum reloads without ever breaking down.
Today's 9.77% surge on elevated volume, coming off a clean EMA-21 bounce and an RSI reset, is a textbook trend resumption signal. The weight of evidence — price structure, moving average alignment, volume behavior, and momentum — all point in the same direction.
Bulls remain firmly in control. The path of least resistance is higher, and any dip toward the EMA-21 in the $1,295 zone should continue to attract buyers as long as the broader tape remains supportive. Watch for a sustained close above $1,580 to confirm the next leg of this extraordinary trend is underway.
_06_11_2026_12_45_08_746277.jpg)


 Please wait processing your request...