
Key Highlights
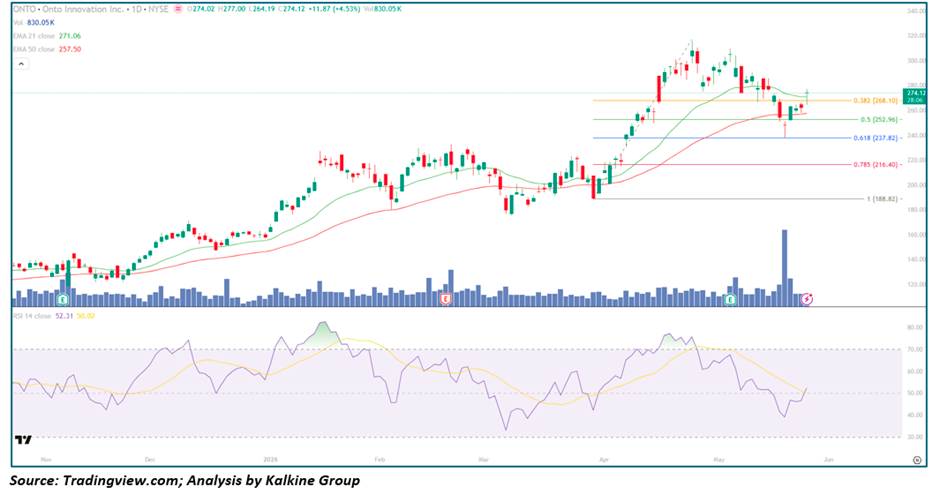
- Onto Innovation Inc. (NYSE: ONTO) closed at $274.12, gaining +$11.87 (+4.53%) in a powerful recovery session that reclaims the critical Fibonacci 0.382 Retracement level at $268.10
- Price traded between $264.19 and $277.00 intraday, closing near the session high — confirming sustained buying pressure throughout the entire day
- The stock is trading above both the EMA-21 ($271.06) and EMA-50 ($257.50), with both averages rising and providing dynamic support beneath the current advance
- RSI-14 at 52.31 with signal at 50.02 — crossing back above the neutral 50 line for the first time since the April correction, a technically significant momentum inflection
- Volume surged to 830.05K — the largest single-session reading in the entire chart history, dwarfing every prior volume bar and confirming extraordinary institutional conviction behind today's move
- Onto Innovation Inc. (NYSE: ONTO) has recovered from its recent low near $237–$240 back above $274, reclaiming multiple Fibonacci levels in a compressed timeframe
Understanding the Fibonacci Retracement Indicator on the Chart
The Fibonacci retracement tool plotted on Onto Innovation Inc. (NYSE: ONTO)'s chart is one of the most widely used Technical Analysis instruments in professional trading. It is constructed by identifying a significant price swing — in this case, the major advance from the March 2026 low near $188.82 to the April 2026 high near $310 — and dividing that range into mathematically derived horizontal levels based on the Fibonacci sequence ratios.
The five retracement levels visible on the chart are:
- 0.382 ($268.10) — the shallowest standard retracement, representing a 38.2% pullback from the prior swing high. This is considered the first meaningful support zone in a healthy uptrend and the level where strongly trending stocks most frequently find buyers. Today's close above this level is technically significant.
- 0.5 ($252.96) — the 50% retracement, not a Fibonacci ratio strictly speaking but universally respected as a major psychological midpoint of any prior move. A close below this level typically signals meaningful trend deterioration.
- 0.618 ($237.82) — the most important Fibonacci level, known as the golden ratio. A retracement to this level represents a 61.8% pullback and is widely considered the deepest correction that can occur while the broader uptrend remains structurally intact. This zone attracted buyers during the recent correction and held as support.
- 0.785 ($216.40) — a deeper retracement representing 78.5% of the prior move. A decline to this level would signal serious structural damage to the uptrend and trigger a fundamental reassessment of the bull thesis.
- 1.0 ($188.82) — the full retracement to the origin of the measured swing, representing a complete give-back of the prior advance and a return to the base.
The fact that Onto Innovation Inc. (NYSE: ONTO) found support between the 0.5 and 0.618 levels during its recent correction — and has now recovered decisively back above the 0.382 level — is a textbook Fibonacci bounce that technical traders treat as a high-conviction continuation signal within the broader uptrend.
Trend Structure: From Steady Uptrend to Fibonacci-Supported Recovery
Phase 1 — Steady Uptrend & Base Expansion (Nov 2025 – Jan 2026)
Onto Innovation Inc. (NYSE: ONTO) entered the chart period in a constructive uptrend from the $130–$140 zone:
- Both EMAs rising steadily in bullish alignment with price consistently above both
- A November Earnings event produced an elevated volume spike and provided the initial catalyst for the advance
- RSI-14 oscillated between 55 and 75 throughout — healthy trending behaviour with no signs of excess
- Price advanced methodically from $140 toward the $220–$230 region through November and December
- A brief February consolidation near $210–$220 reset RSI toward neutral before the next leg higher
Phase 2 — Acceleration & Peak (Feb – Apr 2026)
The character of the advance changed dramatically from late February onward:
- A February earnings catalyst ignited a sharp acceleration from the $210 region toward $310 — a near-vertical move of over 45% in weeks
- Volume expanded meaningfully during the strongest breakout sessions, confirming institutional urgency
- RSI-14 pushed into overbought territory above 70 as momentum reached its peak
- The April high near $310 marked the apex of the advance and the origin point for the Fibonacci retracement levels plotted on the chart
- An April earnings event coincided with a significant volume spike and the beginning of the corrective phase
Phase 3 — Fibonacci Correction & Recovery (Apr – May 2026)
Following the April peak, Onto Innovation Inc. (NYSE: ONTO) underwent a sharp but technically structured correction:
- Price retraced from the $310 highs toward the $237–$240 zone — finding support precisely between the 0.5 ($252.96) and 0.618 ($237.82) Fibonacci levels
- RSI-14 declined toward the 40–45 zone during the correction — a meaningful reset without reaching deeply oversold extremes
- The correction held above the EMA-50 at $257.50 on a closing basis, preserving the broader structural uptrend
- Today's extraordinary volume surge of 830.05K — the largest in the chart's entire history — marks the decisive turning point, with price reclaiming the 0.382 Fibonacci level at $268.10 and closing above it
Moving Averages: Bullish Alignment Preserved Through the Correction
The EMA-21 at $271.06 has held its upward slope throughout the corrective phase — a testament to the underlying strength of the broader trend. Today's close at $274.12 sits just above the EMA-21, confirming that price has reclaimed this critical dynamic support level after the brief corrective dip below it. The EMA-21 now acts as the primary reference level for momentum traders — a close back below it on elevated volume would signal that the recovery is losing conviction.
The EMA-50 at $257.50 has continued trending higher throughout the entire corrective phase, never threatening to flatten or turn lower. Its position approximately 6% below current price provides a robust structural floor for the broader bull thesis. The gap between the two EMAs — approximately $13.50 and stable — confirms that the trend remains intact and that the corrective phase was a consolidation within an uptrend rather than a structural Reversal.
Momentum Analysis: RSI-14 Crossing 50 — A Textbook Recovery Signal
RSI-14 at 52.31 crossing back above the neutral 50 threshold — with the signal line at 50.02 confirming the crossover — is one of the most reliable momentum recovery signals in technical analysis. The 50 level on RSI is not arbitrary; it represents the precise equilibrium between average gains and average losses over the measurement period. A cross above 50 from below signals that the balance of momentum has definitively shifted back to the bulls.
The timing of this RSI crossover — occurring simultaneously with the largest volume session in the chart's history and a close above the 0.382 Fibonacci level — creates a powerful confluence of technical signals that experienced traders treat with the highest level of conviction. Prior RSI recoveries from below 50 in this chart have consistently preceded the strongest subsequent price advances.
Volume Analysis: 830.05K — An Extraordinary Institutional Signal
Today's volume of 830.05K is not just elevated — it is categorically different from every other session in the chart. The next largest volume bar visible is approximately 160K shares, making today's session over five times larger than any prior single day. This kind of volume event is what technical analysts call a Capitulation-and-reversal signal — the final exhaustion of sellers followed by an overwhelming surge of institutional buying that establishes a durable price floor.
The significance cannot be overstated: when a stock produces its single largest volume session in months at a Fibonacci support level while simultaneously reclaiming its EMA-21 and crossing RSI back above 50, the technical community treats this as one of the highest-conviction reversal and continuation signals available.
Key Technical Levels
Resistance Levels
- $277.00 — today's intraday high and immediate session resistance
- $280.00 — major psychological resistance and prior consolidation ceiling
- $295–$300 — next significant resistance zone and measured recovery target
- $310 — April 2026 all-time high and ultimate bull case target
Support Levels
- $271.06 — EMA-21 and primary dynamic support
- $268.10 — Fibonacci 0.382 retracement — now critical support after today's reclaim
- $257.50 — EMA-50 and secondary structural support
- $252.96 — Fibonacci 0.5 retracement — major support zone
- $237.82 — Fibonacci 0.618 golden ratio — ultimate correction support
Scenario Analysis
- Bullish Continuation (Primary Case)
Onto Innovation Inc. (NYSE: ONTO) sustains above the 0.382 Fibonacci level at $268.10: → Momentum builds toward the $280 psychological resistance zone → A clean close above $280 opens the path toward $295–$300 → RSI-14 advancing toward 60–65 would confirm the recovery momentum is genuine and sustained → The extraordinary volume of today's session establishes a powerful Demand zone that attracts further institutional buying
- Consolidation Near Recovery Highs (Constructive Outcome)
Following today's surge, Onto Innovation Inc. (NYSE: ONTO) digests between $265–$277: → RSI-14 stabilises in the 50–58 range while EMAs rise to reduce the extension → A tight consolidation above the 0.382 Fibonacci level would create a high-conviction continuation pattern → No thesis damage while price holds above EMA-21 at $271.06 and the 0.382 level at $268.10
- Mean Reversion Pullback (Risk Case)
A failure to hold above the 0.382 level at $268.10 on follow-through sessions: → First downside target at EMA-21 near $271.06 — already very close to current price → A close below the 0.382 level on elevated volume would shift near-term bias back to neutral → The 0.5 Fibonacci level at $252.96 and EMA-50 at $257.50 converge as the next major structural support zone → Provided those levels hold, the broader bull thesis for Onto Innovation Inc. (NYSE: ONTO) remains entirely intact
Conclusion: Onto Innovation Inc. (NYSE: ONTO) Is Staging a Technically Exceptional Recovery — The Volume Tells the Story
Onto Innovation Inc. (NYSE: ONTO) has produced one of the most technically compelling single-session reversals visible in the current market. The confluence of factors — the largest volume in chart history, a close above the 0.382 Fibonacci retracement, RSI-14 crossing back above 50, and price reclaiming the EMA-21 — creates a rare alignment of signals that the technical community treats as a high-conviction recovery confirmation.
The framework moving forward is clear:
- Above $268.10 (Fibonacci 0.382) → recovery momentum dominant, target $280 psychological resistance
- Above $280.00 → psychological breakout, advance toward $295–$300 opens
- Above $300.00 → momentum expansion, all-time high retest at $310 comes into view
- Below EMA-21 at $271.06 → near-term caution, monitor for follow-through conviction
- Below $252.96 (Fibonacci 0.5) → broader recovery thesis under review
- Below $237.82 (Fibonacci 0.618) → structural reassessment required
For momentum traders and semiconductor-focused growth investors, Onto Innovation Inc. (NYSE: ONTO) represents one of the most technically well-supported recovery setups in the current market — a Fibonacci bounce of the highest quality, confirmed by volume that leaves no ambiguity about the identity of today's buyers.
_06_11_2026_12_45_08_746277.jpg)


 Please wait processing your request...