
 CA
 NZ
 UK
 AU
 IND

 US

 Share
 X (Formerly Twitter)
 Whatsapp
 Facebook
 LinkedIn
 Telegram
 Email This Article
 Copy Link
 Summarize with AI
 Chat GPT
 Perplexity

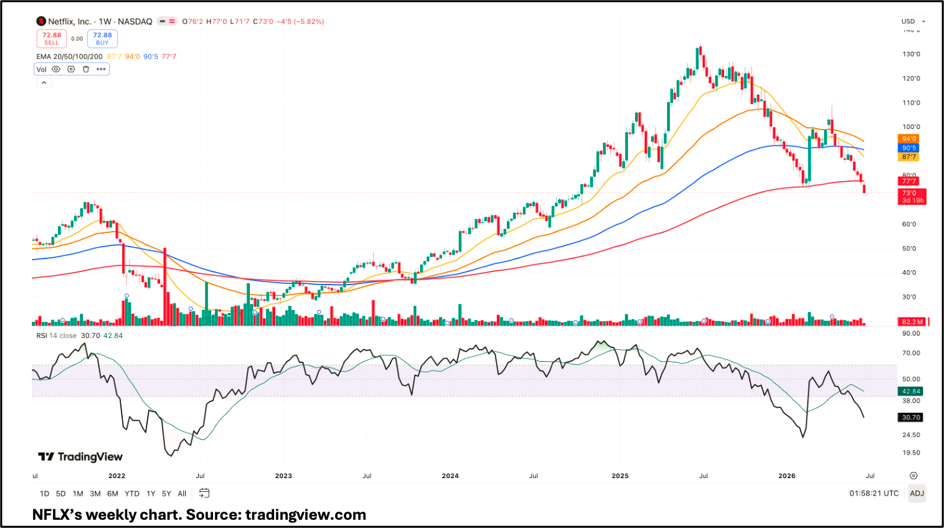
Netflix Inc. (NASDAQ:NFLX) is in a confirmed structural downtrend on the weekly timeframe. Price has broken below all four exponential moving averages — EMA 20, 50, 100, and 200 — with the critical breach of the 200 EMA on a weekly closing basis signalling a regime change in the macro trend. Volume confirms institutional distribution. RSI at 30.70 is approaching oversold territory but shows no bullish divergence. The path of least resistance remains lower, with next structural support targets at $65–68 and the 2022 base zone at $55–60. The bias is bearish. Any tactical bounce should be treated as a short-selling opportunity until price reclaims and holds above the 200 EMA on a weekly close.
Key Highlights
- Full Bearish EMA Waterfall
Price at $73 is below all four EMAs — every average is now overhead resistance with no support beneath. - 200 EMA Broken — Regime Change
Weekly close below $77.7 signals a macro trend shift. This is the line institutional funds use as their primary long/short filter. - RSI Near Oversold — Not a Buy
RSI at 30.70 looks cheap but has no bullish divergence. Momentum is still falling with price — selling is not exhausted. - Next levels — $65 and $55
First support at $65–68 (2023 base), then $55–60 (2022 accumulation zone). Any bounce to $77–80 is a short opportunity.
- Price Structure and Trend Context
From its peak near $130 in late 2024 through early 2025, NFLX has undergone a sustained, orderly distribution phase. The weekly chart tells a clear story: after a strong multi-year recovery from the 2022 lows (where NFLX famously collapsed from over $700 to below $180 on a split-adjusted basis), the stock built a base and staged a meaningful recovery through 2023 and 2024, reaching a high of approximately $130.
That recovery has now been fully reversed from a trend perspective. The current price of $73.00 represents a decline of over 43% from the recent highs, and more importantly, the decline has been systematic — a gradual roll-over rather than a panic spike, which is characteristic of institutional selling rather than retail capitulation.
This distinction matters significantly to hedge fund analysts. Panic spikes tend to reverse quickly. Systematic distribution — where large positions are unwound over weeks and months — tends to resolve with continued lower prices over a longer duration.
- EMA Stack Analysis — The Definitive Bearish Signal
The exponential moving average structure is the first and most conclusive indicator of trend direction on this chart.
|
EMA |
Level |
Distance from Price |
Status |
|
EMA 20 |
$87.7 |
−16.7% |
Overhead resistance |
|
EMA 50 |
$94.0 |
−22.3% |
Overhead resistance |
|
EMA 100 |
$90.5 |
−19.3% |
Overhead resistance |
|
EMA 200 |
$77.7 |
−6.1% |
Recently broken |
The EMA stack is negatively ordered. In a healthy bull market, the EMA 20 trades above the EMA 50, which trades above the EMA 100, which trades above the EMA 200 — and price trades above all of them. The exact opposite is true here. Every single moving average is now overhead resistance. This configuration is sometimes called a "bearish EMA waterfall" — and it is one of the most reliable continuation signals in technical analysis on higher timeframes.
The 200 EMA Breach — A Regime Change
The most significant development on this chart is the weekly close below the 200 EMA at $77.7.
The 200 EMA on a weekly chart is the primary trend filter used by institutional desks globally. It is not a trading signal in isolation — it is a regime indicator. When price trades above it, the systematic bias is long. When price breaks below it on a weekly closing basis, the macro regime shifts to bearish.
This is not a level that major funds treat lightly. Many systematic strategies — including CTAs (Commodity Trading Advisors) and quant funds — use the weekly 200 EMA as a hard filter. A confirmed breach typically triggers selling from these participants, creating a self-reinforcing feedback loop that adds to downward pressure.
Critically, a single weekly close below the 200 EMA can sometimes be a false break. What makes this breakdown more convincing is that price is also below the EMA 20, 50, and 100 simultaneously — there is no near-term moving average offering support.
- RSI Analysis — Oversold Without Divergence
The RSI (14-period) currently reads 30.70, with its signal line (the smoothed average of RSI) at 42.84. This wide gap between RSI and its signal is significant — it indicates the velocity of the decline has been sharp and sustained, not a slow bleed.
Why Oversold Is Not a Buy Signal Here
A common error made by retail participants is treating an RSI near 30 as a contrarian buy signal. In a broken trend structure, this can be a costly mistake. RSI measures the speed of price change, not the absolute level of value. It can remain depressed for extended periods in strong downtrends — as NFLX itself demonstrated during the 2022 selloff, where RSI spent weeks below 30 before any meaningful recovery.
What to Watch For — Bullish Divergence
The signal worth waiting for is bullish divergence: a scenario where price makes a new lower low, but RSI makes a higher low. This indicates underlying momentum is improving even as price continues falling, and it is the type of early warning that precedes genuine trend reversals.
That divergence is currently absent. RSI is falling in alignment with price — momentum is confirming the downtrend, not warning against it. Until divergence appears, the oversold RSI reading is a description of the damage, not a prescription for a long entry.
- Volume Analysis — Institutional Distribution Confirmed
Volume analysis on the weekly chart confirms the bearish thesis. The recent selloff from approximately $130 to the current $73 has been accompanied by elevated red (down) volume bars, with the most recent week printing 82.2 million shares — a notably high reading.
This pattern is consistent with what Wyckoff analysts call distribution — a phase in which informed, institutional participants systematically exit large positions under the cover of declining prices. The key characteristic is that down weeks show heavier volume than up weeks, indicating that selling pressure is structurally greater than buying pressure at current levels.
This is distinct from a capitulation spike, which would typically show a single, extreme-volume week followed by an immediate reversal. The gradual elevation of volume on down weeks over several months suggests a deliberate, patient unwinding of institutional long positions.
- Key Price Levels
Resistance Levels
$77.7 — EMA 200 (Critical) The first and most important level to reclaim for any bullish reversal thesis. A weekly close back above this level, ideally accompanied by expanding volume, would be the earliest signal that the macro trend may be stabilising. Until this occurs, it functions as the ceiling on any bounce.
$87.7 — EMA 20 The first major EMA cluster overhead. Even in a bear market rally scenario, reaching the EMA 20 would represent a 20% bounce from current levels — a significant move that would likely be sold by institutions who missed the initial exit.
$90–94 — EMA 50/100 Cluster Beyond the EMA 20, the EMA 50 ($94) and EMA 100 ($90.5) form a dense resistance cluster. Any recovery into this zone would be a high-probability short-selling area for hedge fund desks.
Support Levels
$65–68 — 2023 Consolidation Highs The breakout level from the 2023 base now becomes potential support on a throwback basis. This is a natural first target for continued selling pressure.
$55–60 — 2022 Accumulation Base The most significant structural support on the chart. This is the zone where institutional buyers aggressively accumulated NFLX following the 2022 crash. If selling pressure continues and the $65–68 level fails to hold, this is the next area where genuine demand may re-emerge.
- Comparison to the 2022 Selloff
The current decline invites a natural comparison to the catastrophic 2022 selloff. There are meaningful similarities and differences worth noting.
Similarities:
- Weekly RSI reaching the 25–35 zone in both cases
- Price breaking below the 200 EMA weekly
- High-volume distribution preceding the decline
Differences:
- The 2022 selloff was more violent (>75% peak-to-trough) and driven by a combination of subscriber loss revelations and a broad tech multiple compression
- The current decline is more measured and structural, suggesting either a cyclical correction or the early stages of a new bear phase
- In 2022, RSI showed clear bullish divergence before the reversal — a signal not yet present in the current setup
- Scenarios and Tactical Framework
Bear Case (Primary — 65% probability weight)
Continued selling pressure with no reclaim of EMA 200. Price tests the $65–68 support zone within the next 4–8 weeks. If that level fails, the 2022 base at $55–60 becomes the target. In this scenario, any bounces toward $77–80 represent shorting opportunities.
Neutral/Consolidation Case (25% probability weight)
Price stabilises in the $68–77 range as RSI works off the oversold condition through time rather than price. A sideways chop for several weeks is possible before the next directional move. This scenario does not change the intermediate-term bearish bias — it merely delays it.
Bull Case (10% probability weight)
A sharp, high-volume reversal week followed by a sustained reclaim of the 200 EMA ($77.7) on a weekly close. This would require either a significant positive fundamental catalyst (blowout earnings, major strategic announcement) or a broader market rally lifting all boats. This scenario remains very low probability while price is below the EMA 200 and RSI shows no divergence.
- Trading Implications
For short sellers: The current structure offers a high-probability short entry on bounces toward the $77–80 zone (EMA 200 resistance). A stop above $85 (above EMA 200 with a buffer) keeps risk defined. Target: $65–68 initially, with $55–60 as the extended objective.
For long-term investors: The weekly 200 EMA breach is a serious warning. Scaling out of long positions on any relief bounces toward $77–80 is a prudent risk management approach until the macro trend structure repairs.
For options traders: Elevated implied volatility on a stock in a confirmed downtrend creates opportunities in defined-risk bearish strategies. Bear put spreads or long puts with a 60–90 day expiry capture the directional move while limiting the risk of a sudden fundamental reversal.
- What Would Change This View
The bearish thesis remains intact as long as:
- Price stays below the weekly 200 EMA ($77.7)
- RSI continues falling without showing bullish divergence
- Volume remains higher on down weeks than up weeks
A shift to neutral or bullish would require all three of the following:
- A weekly closing price above $77.7 (EMA 200 reclaim)
- RSI recovery above 50 with bullish divergence confirmed
- Volume expansion on up weeks exceeding that of down weeks
None of these conditions are currently present.
Disclaimer
This article is for educational and informational purposes only. It represents a technical analysis of publicly available chart data and does not constitute investment advice, a recommendation to buy or sell, or a solicitation of any investment. All investments involve risk, including the possible loss of principal. Past technical patterns do not guarantee future results. Readers should conduct their own due diligence and consult a qualified financial advisor before making any investment decisions.


 Nov 05, 2026





 Please wait processing your request...